

Weekly LIVE Insights
02/24/2026
This article is for you if you’re livestreaming without knowing how or where to analyze your performance, struggling to understand your audience, and missing opportunities to grow engagement and sales.
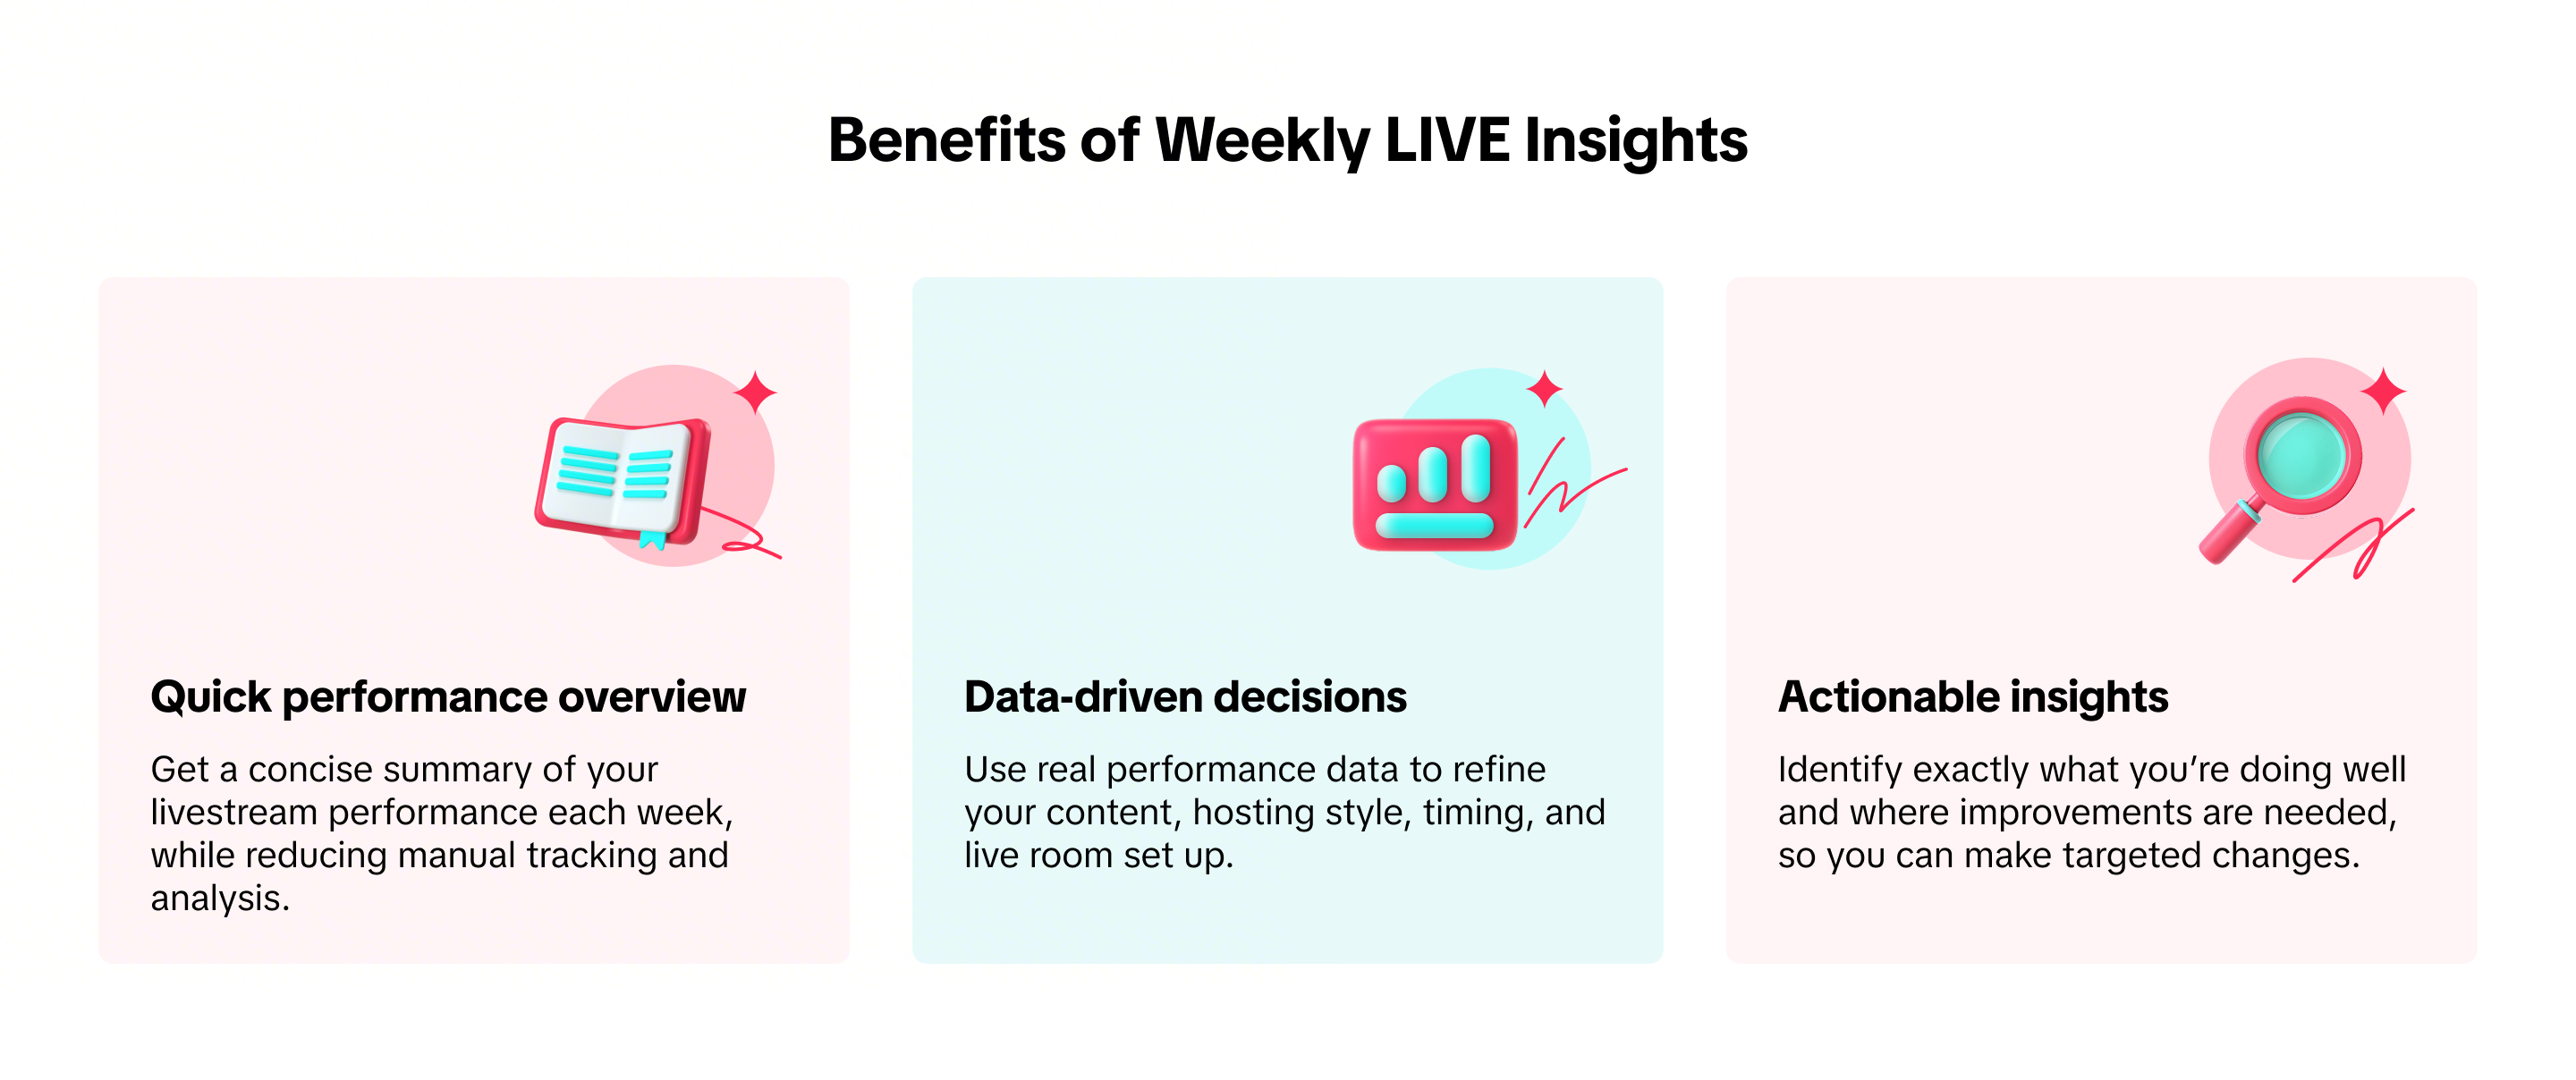
Learn how to leverage Weekly LIVE Insights report to review your overall livestream performances, uncover actionable ways to improve your future livestreams, and ensure they meet standards of a high quality liveroom!
All images within this article are for reference purposes only and the actual interface may vary slightly.


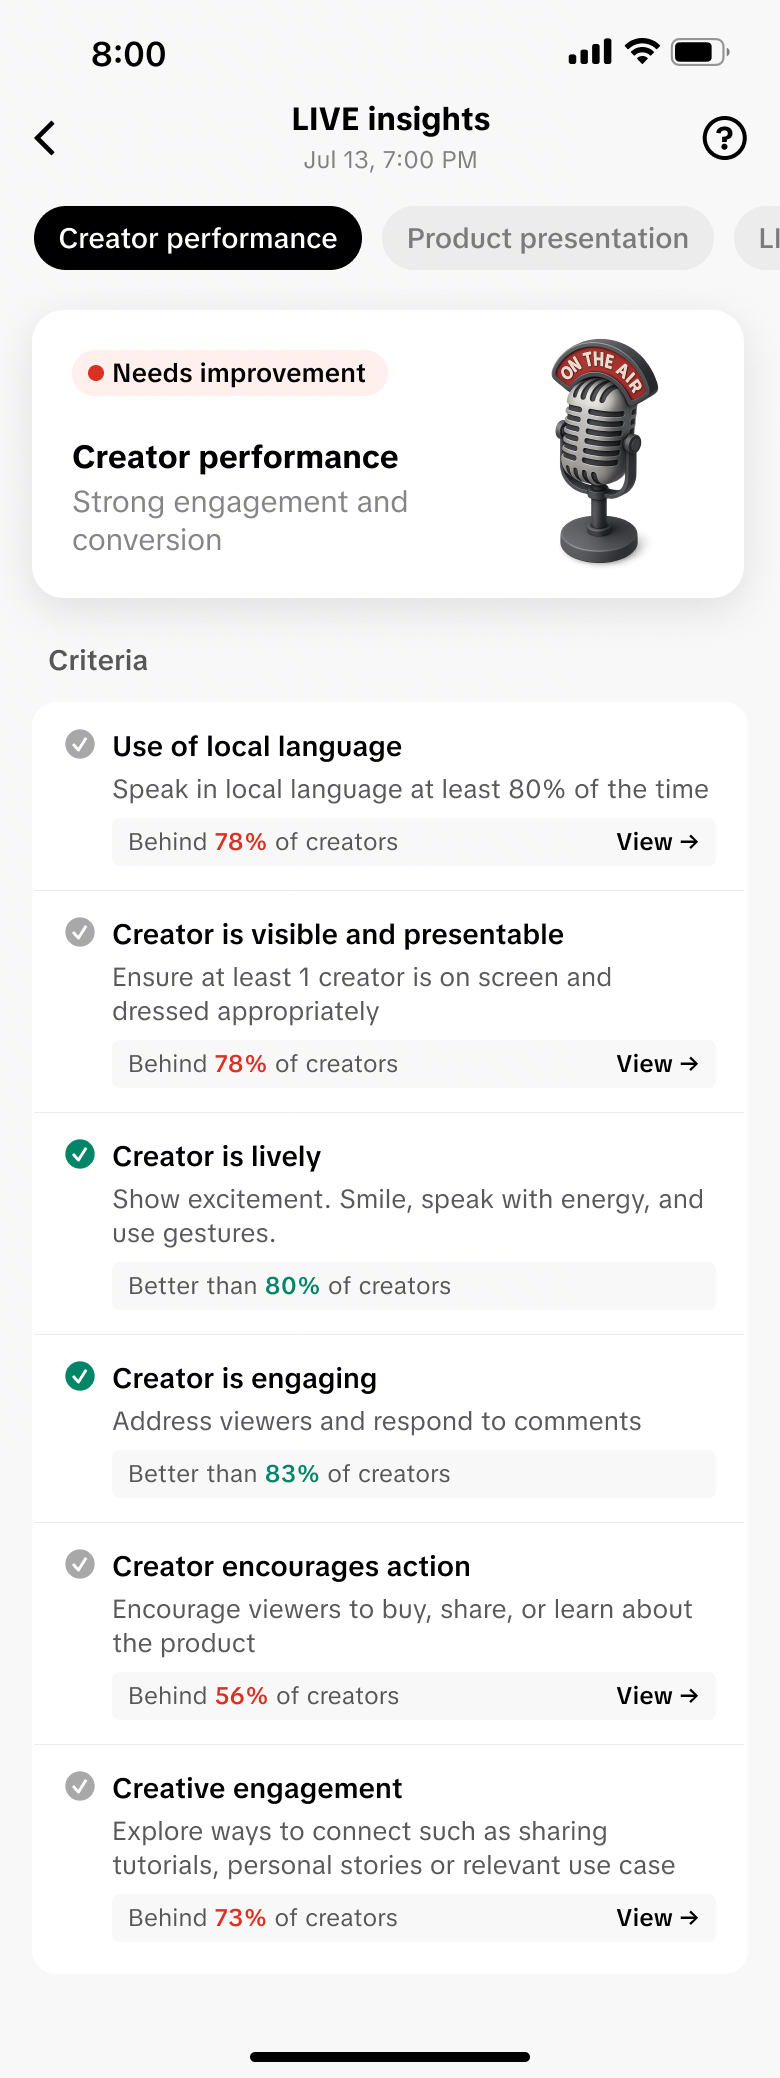
Livestreaming Quality CriteriaThese four aspects of livestream performance play a key role in driving traffic, engagement, and conversions. Each aspect breaks down effective content strategies in a clear, easy-to-understand way, giving you actionable guidance to capture audience attention and support long-term business growth.
Learn more strategies to upgrade your livestream quality here.

Learn how to leverage Weekly LIVE Insights report to review your overall livestream performances, uncover actionable ways to improve your future livestreams, and ensure they meet standards of a high quality liveroom!
All images within this article are for reference purposes only and the actual interface may vary slightly.
What is Weekly LIVE Insights
Available to all sellers and affiliate creators, Weekly LIVE Insights is an auto-generated weekly report that:- Summarizes your overall weekly livestream performance at a glance
- Helps you deep dive into individual liveroom performances
- Identify specific areas where your livestreams are performing well or could be improved
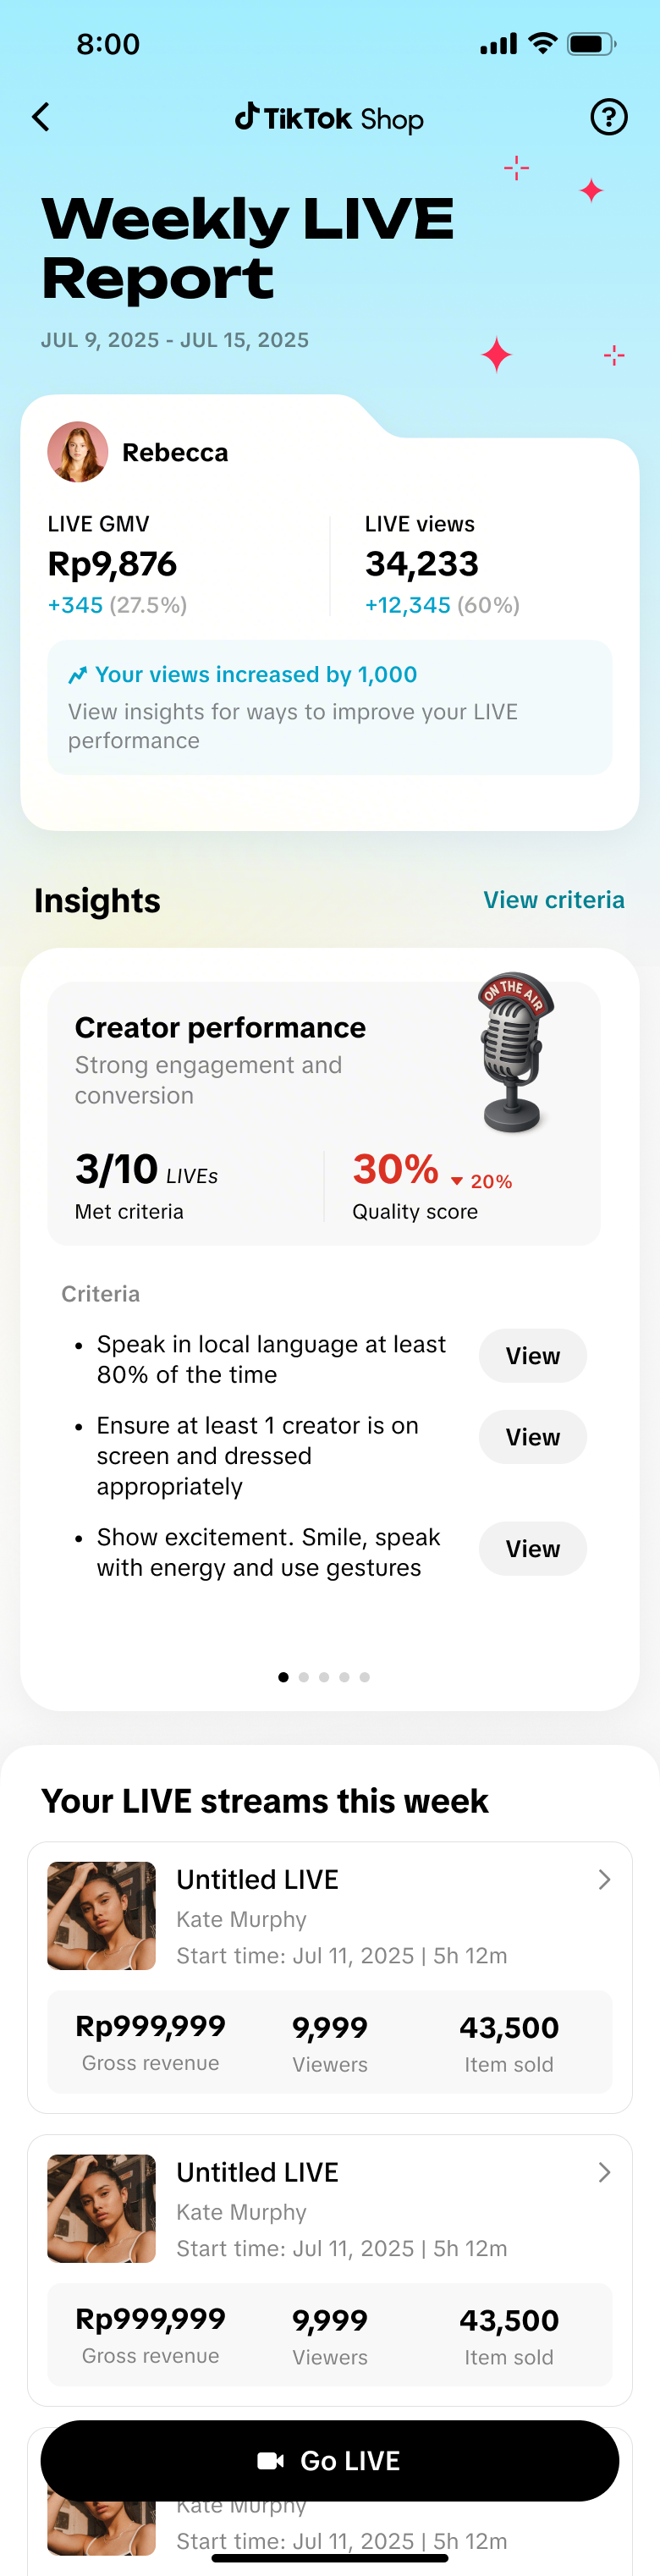 |  |  |
Weekly LIVE Report | LIVE insights | LIVE details |
Where to Get Weekly LIVE Insights
Weekly LIVE Insights can be accessed via App through the Creator Center: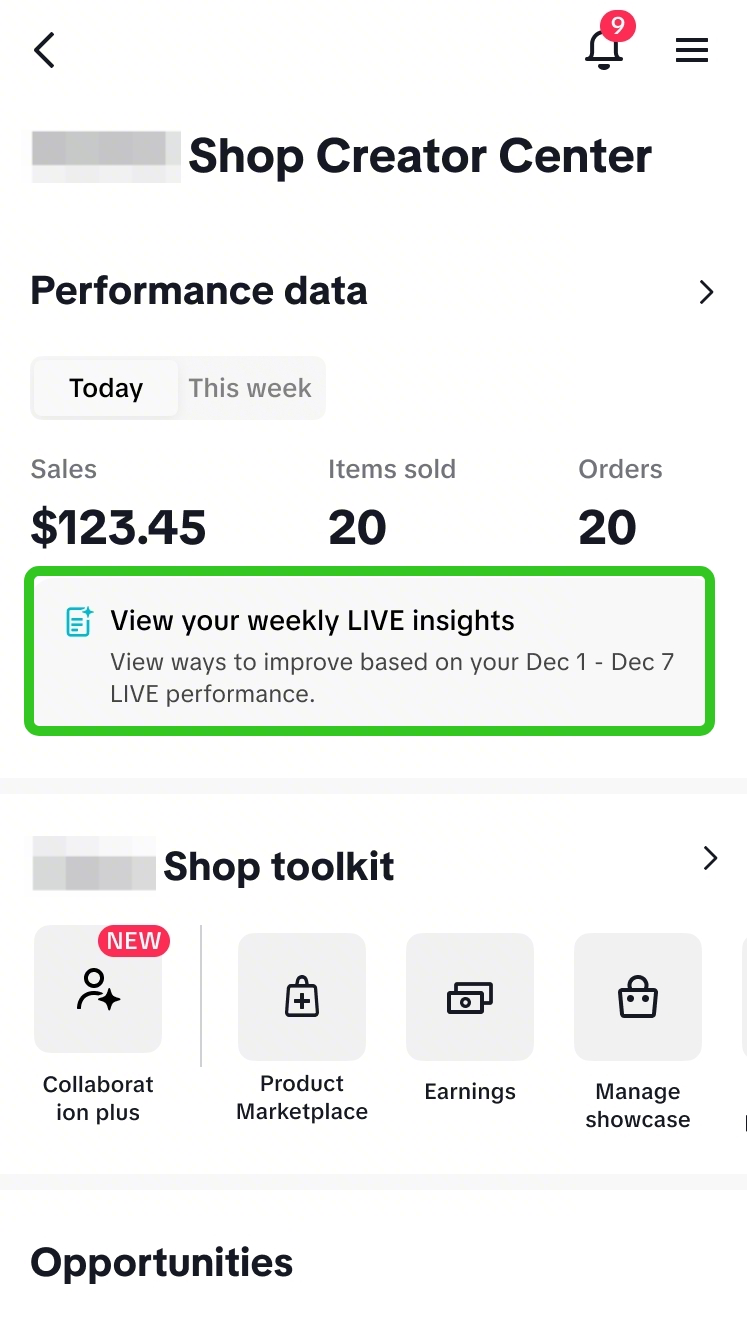 | 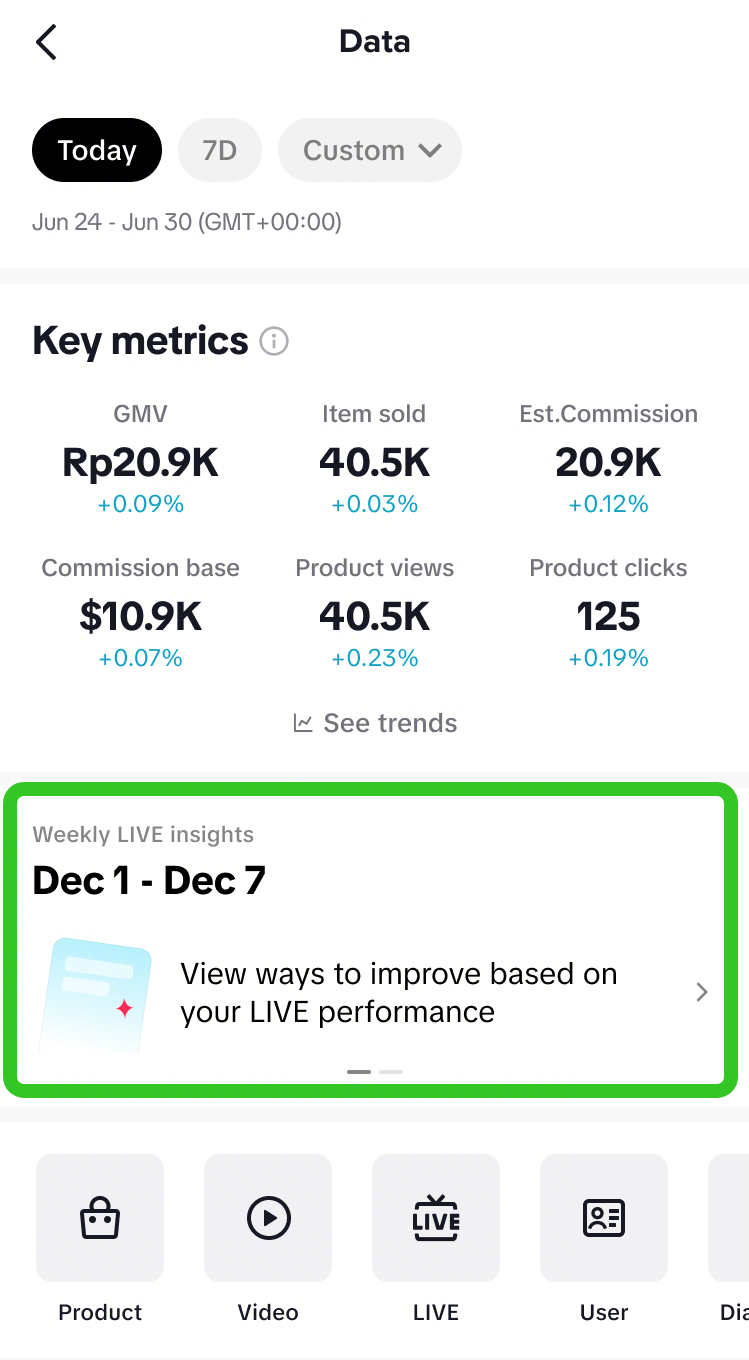 | 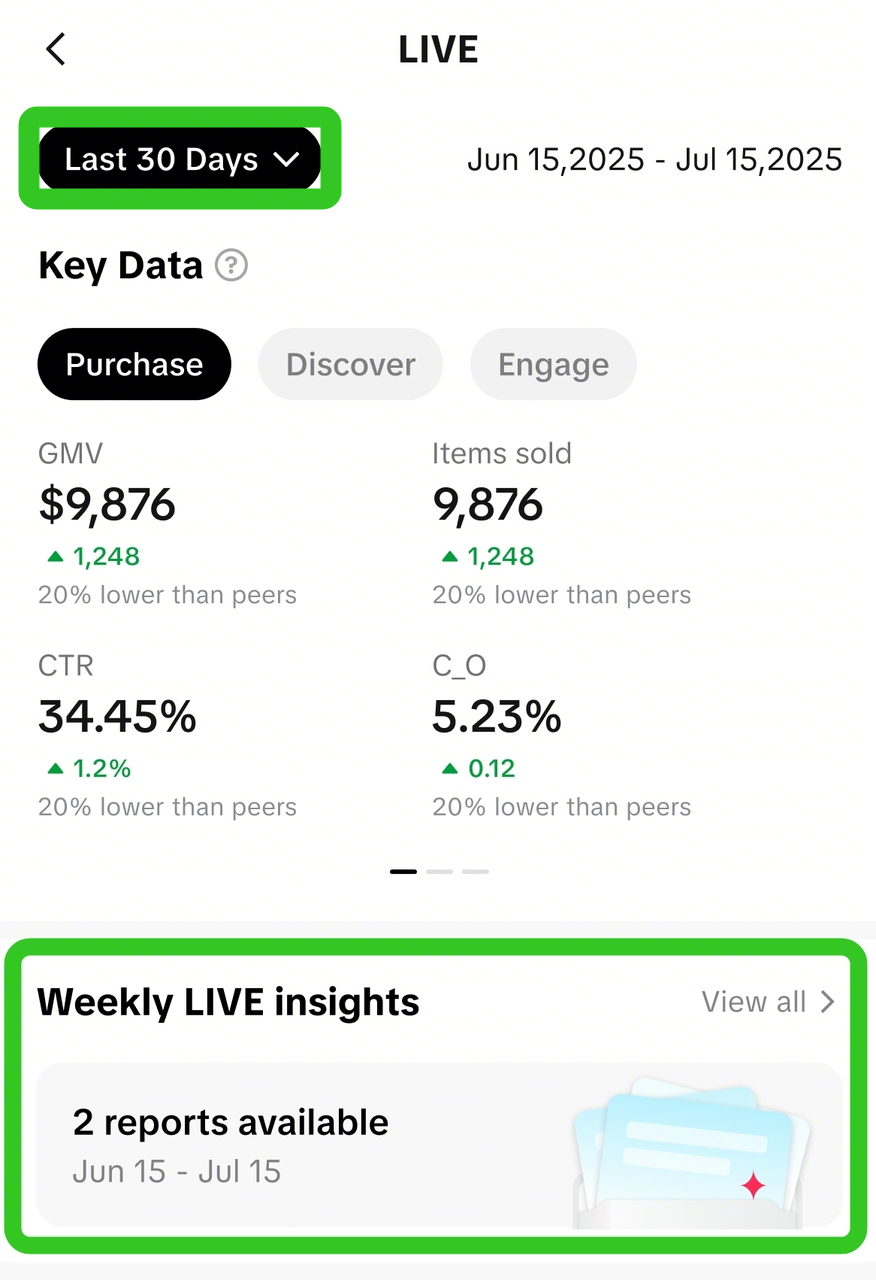 | 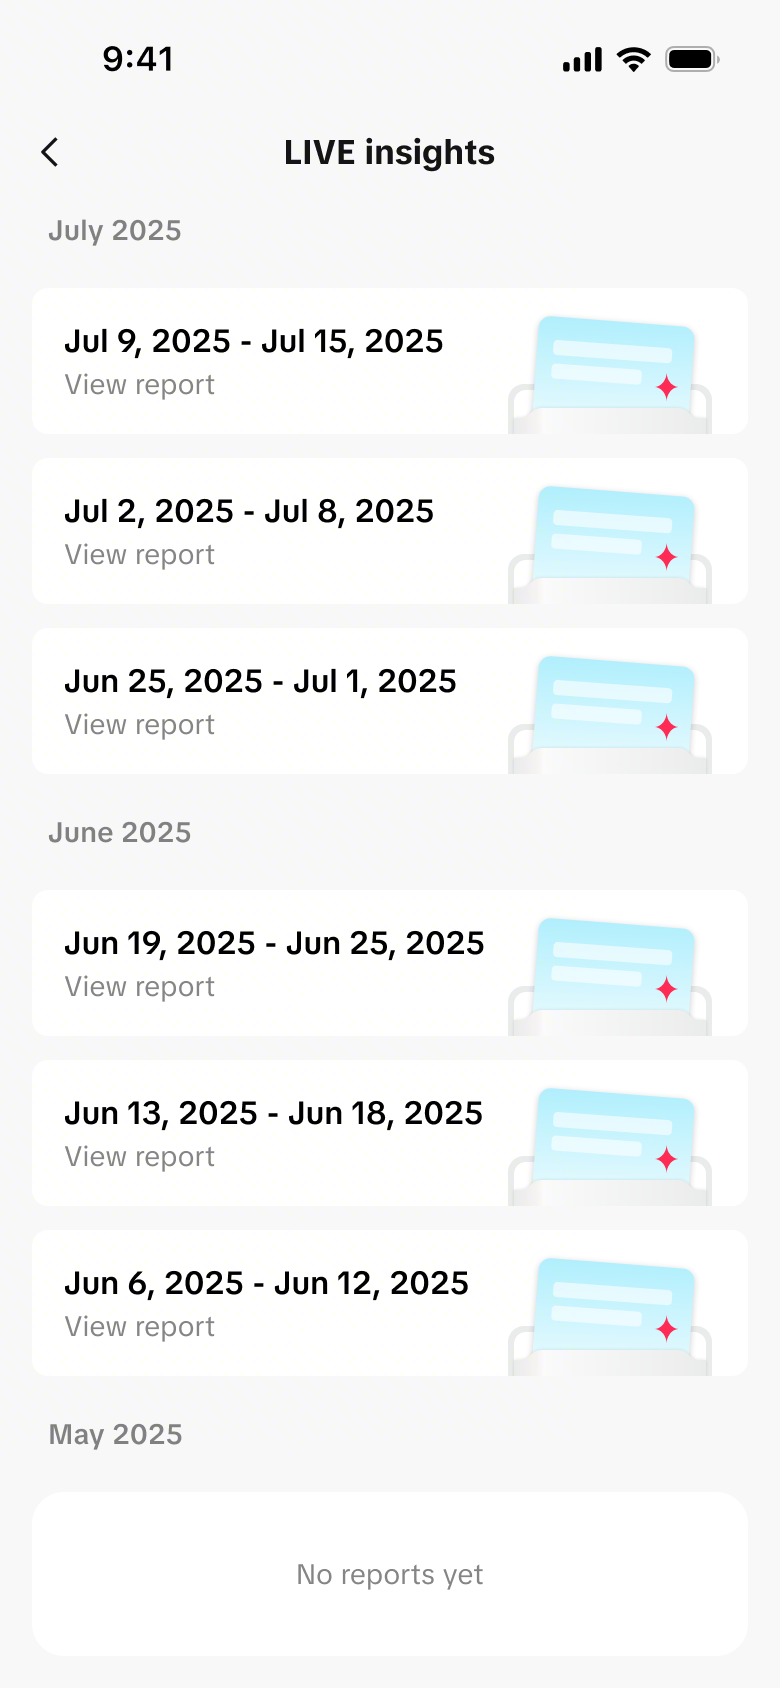 | 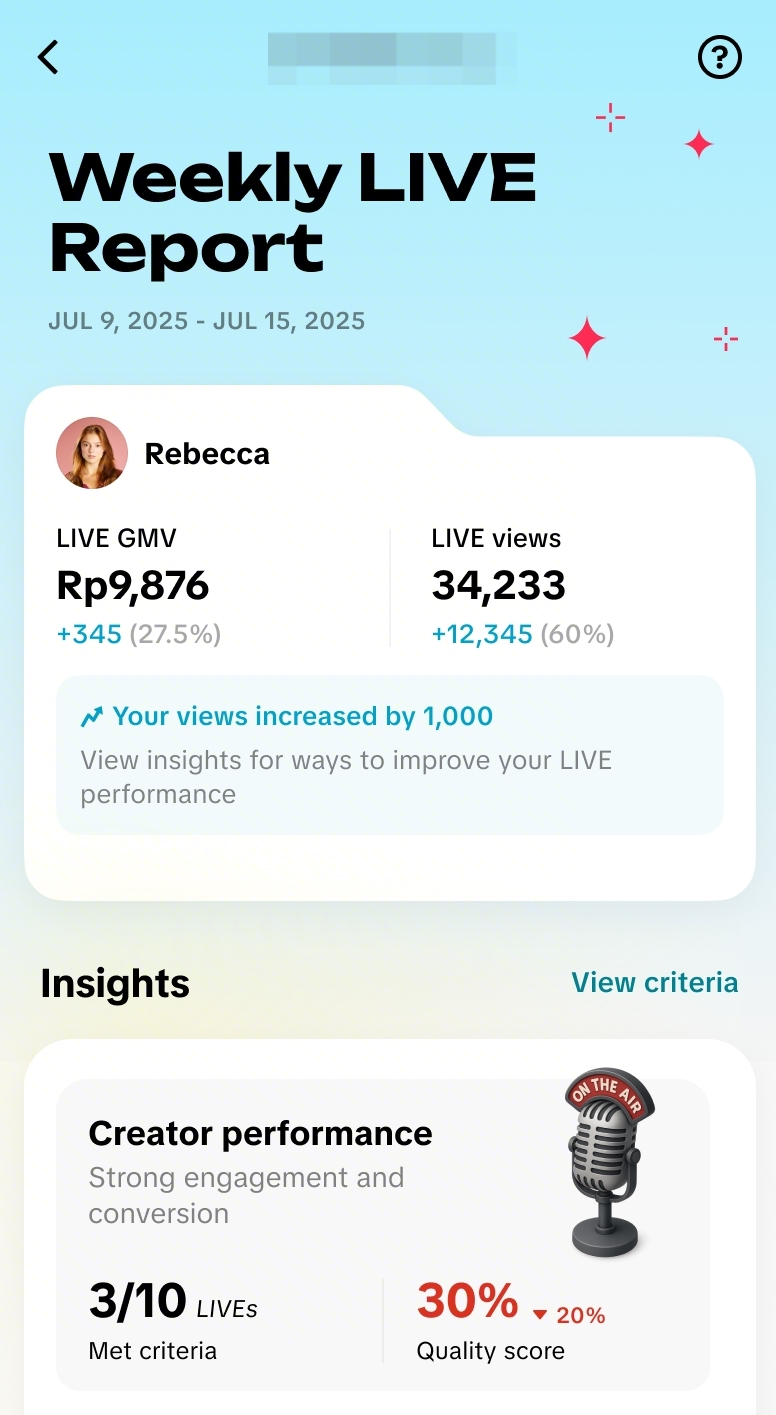 |
| ||||
Analyse Your LIVE Performance
Review Weekly LIVE Summary
 Weekly LIVE Report homepage | 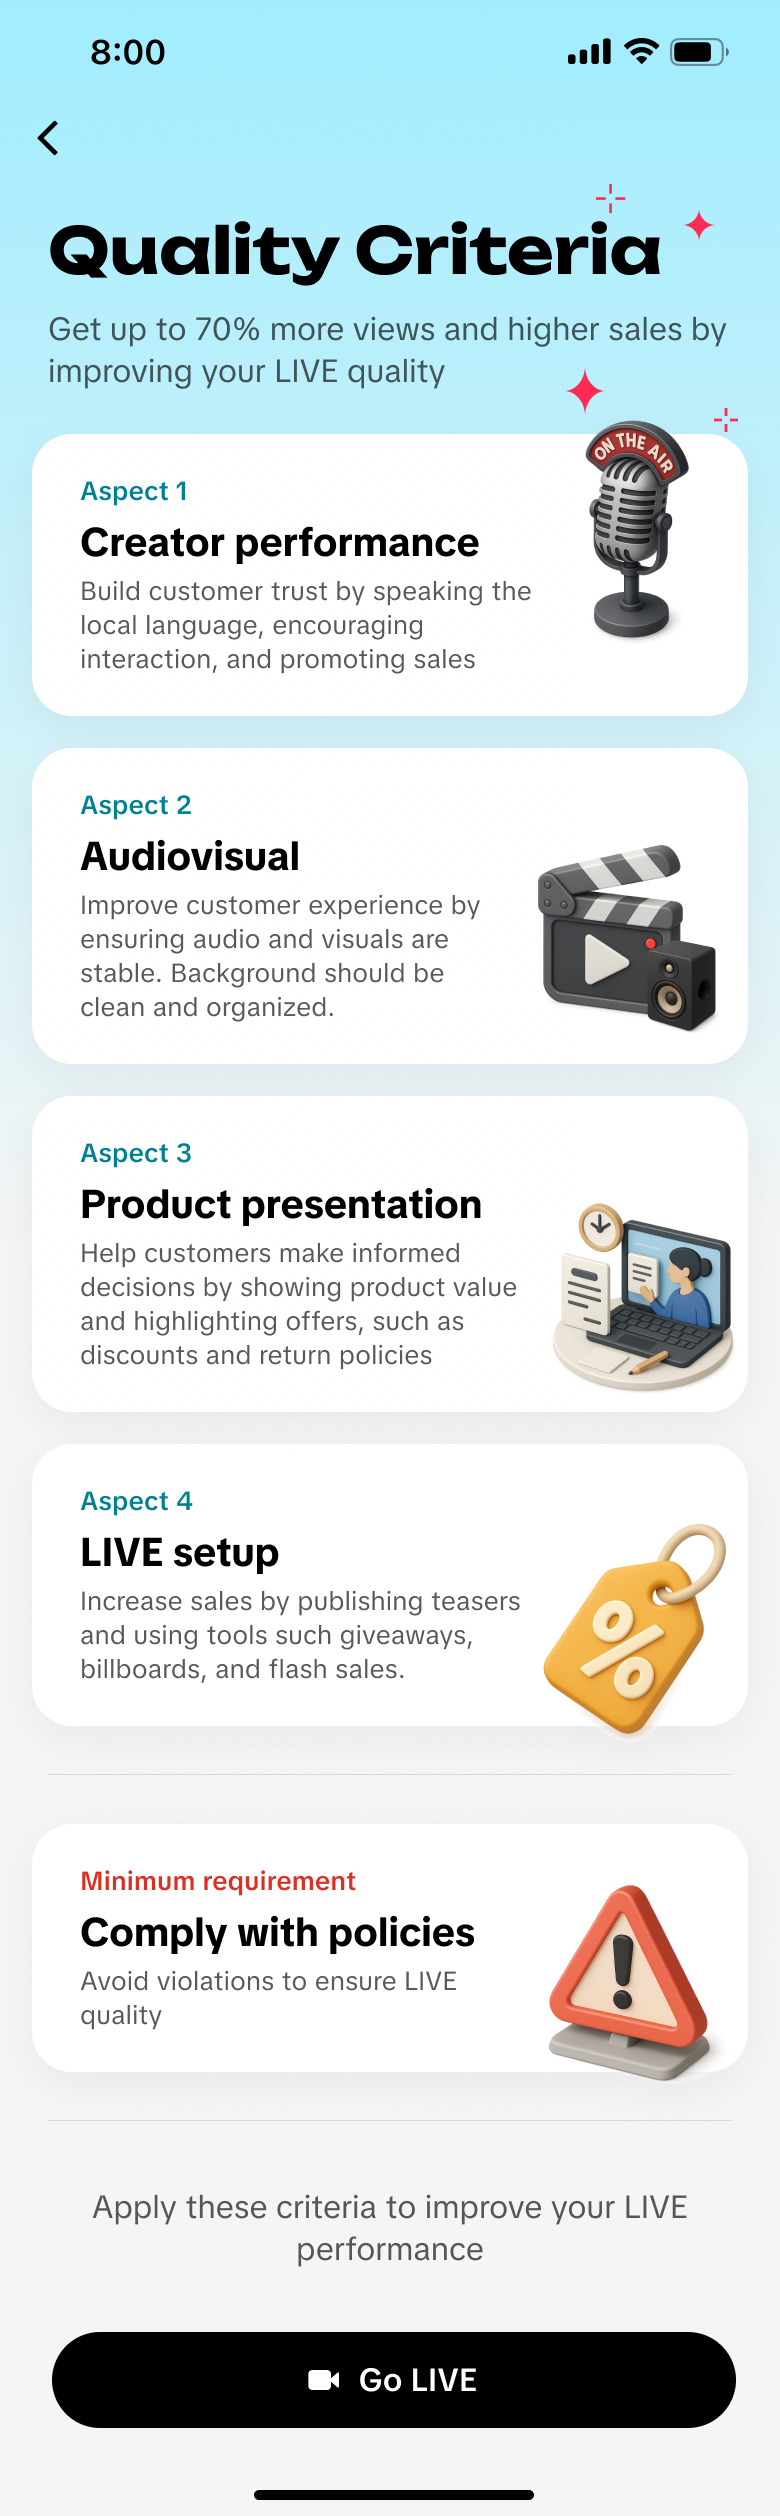 Quality Criteria |
|
| ||
| ||
| ||
| ||
|
| Creator Performance | LIVE setup | Product presentation | Audiovisual |
 | 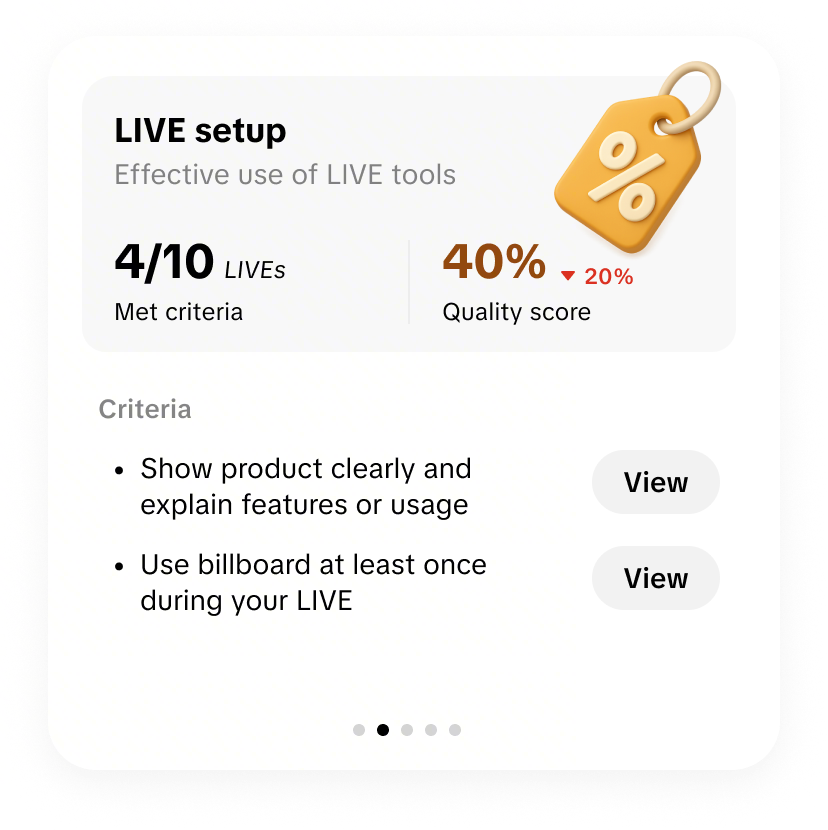 | 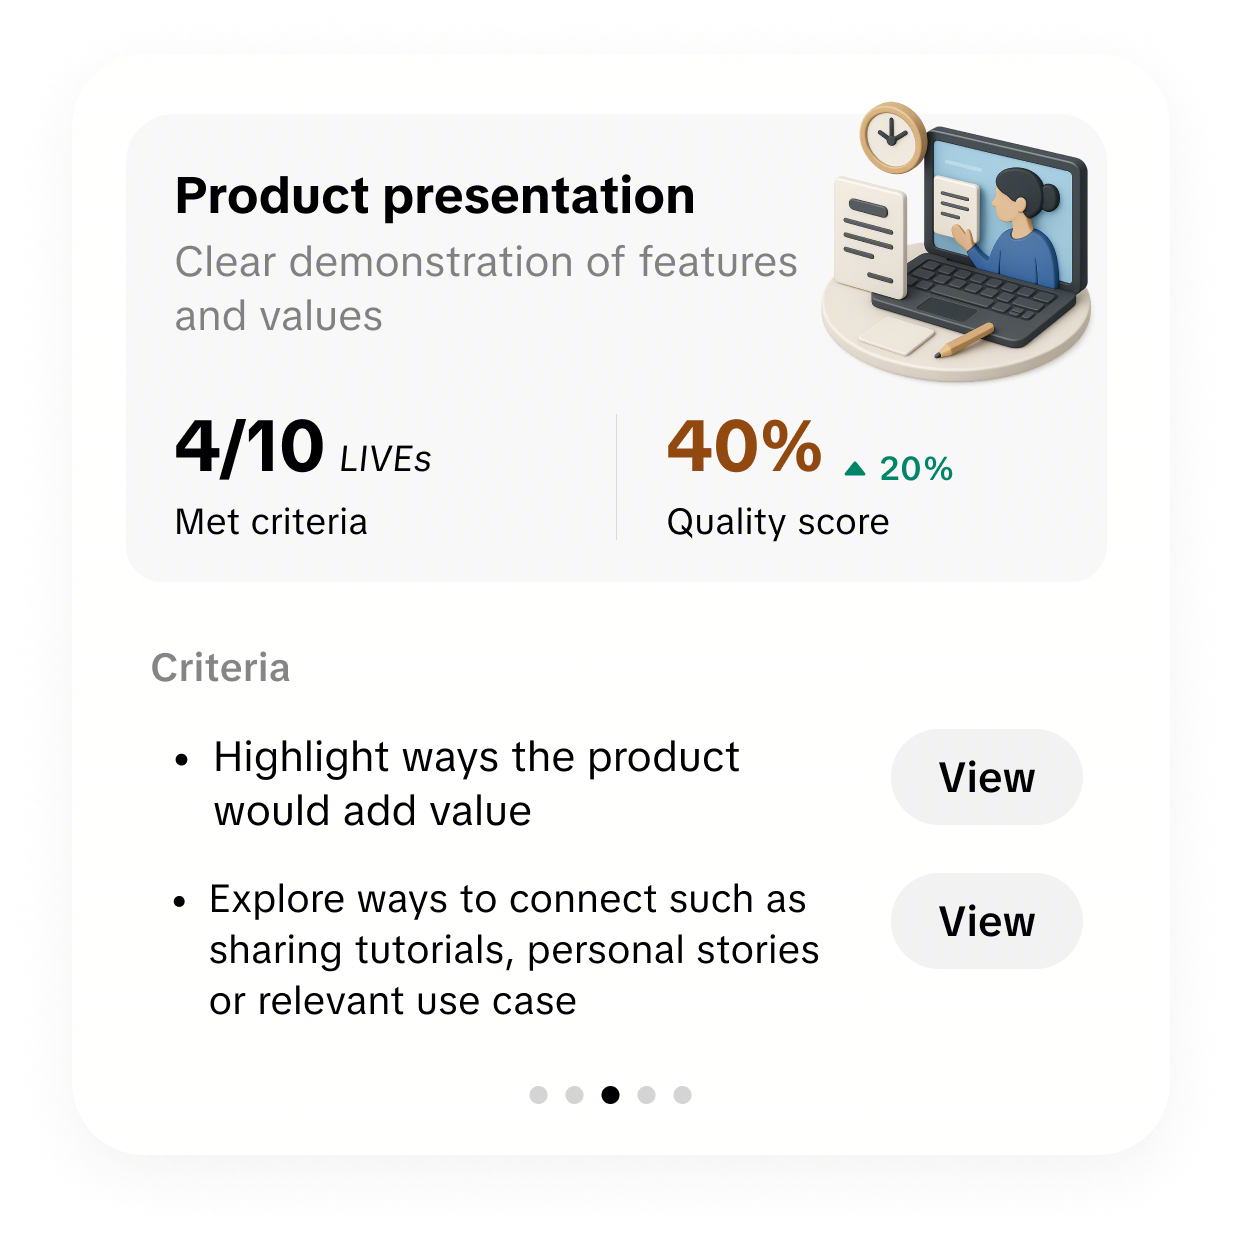 | 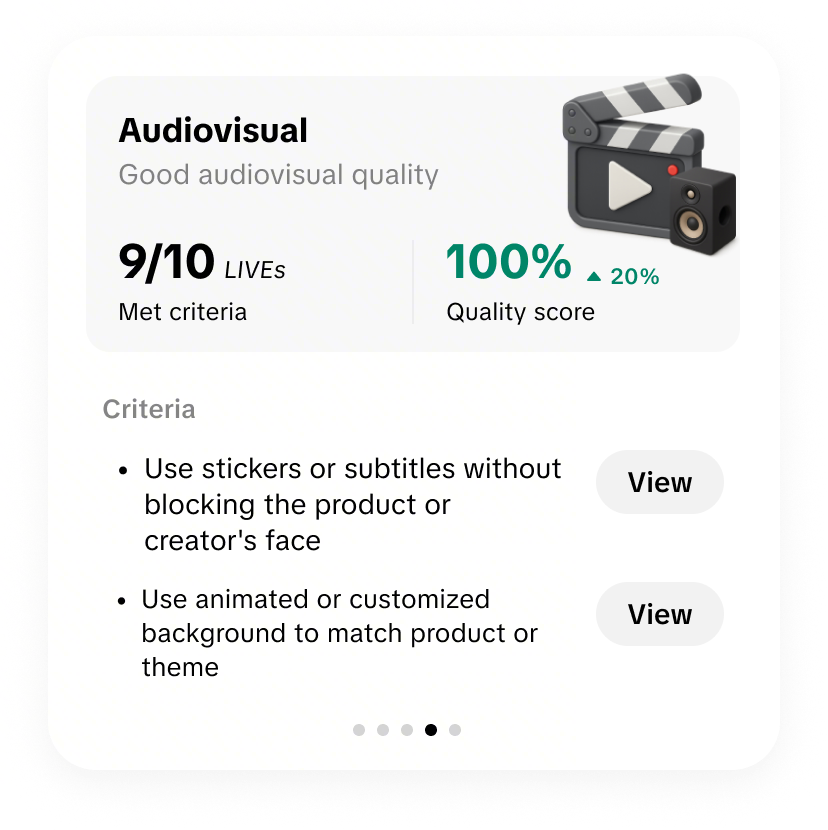 |
Build customer trust by speaking the local language, encouraging interaction, and promoting sales | Increase sales by publishing teasers and using tools such giveaways, billboards, and flash sales. | Help customers make informed decisions by showing product value and highlighting offers, such as discounts and return policies | Improve customer experience by ensuring audio and visuals are stable. Background should be clean and organized. |
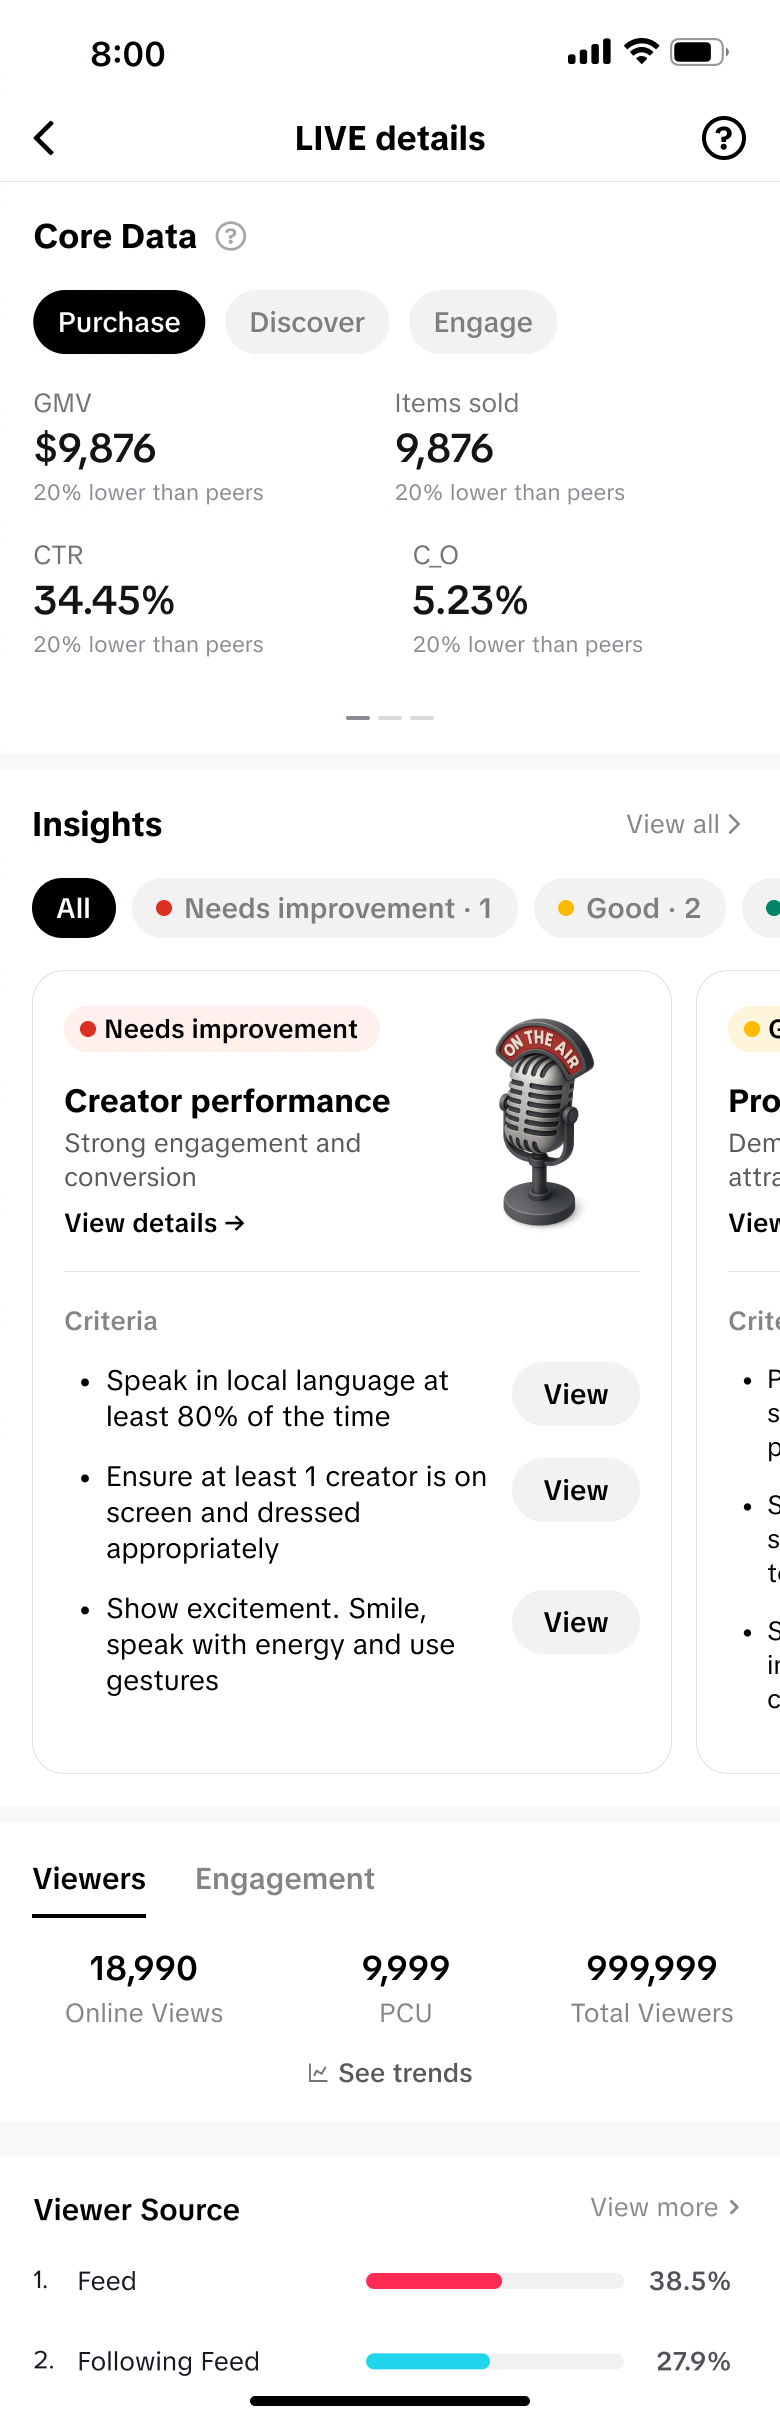
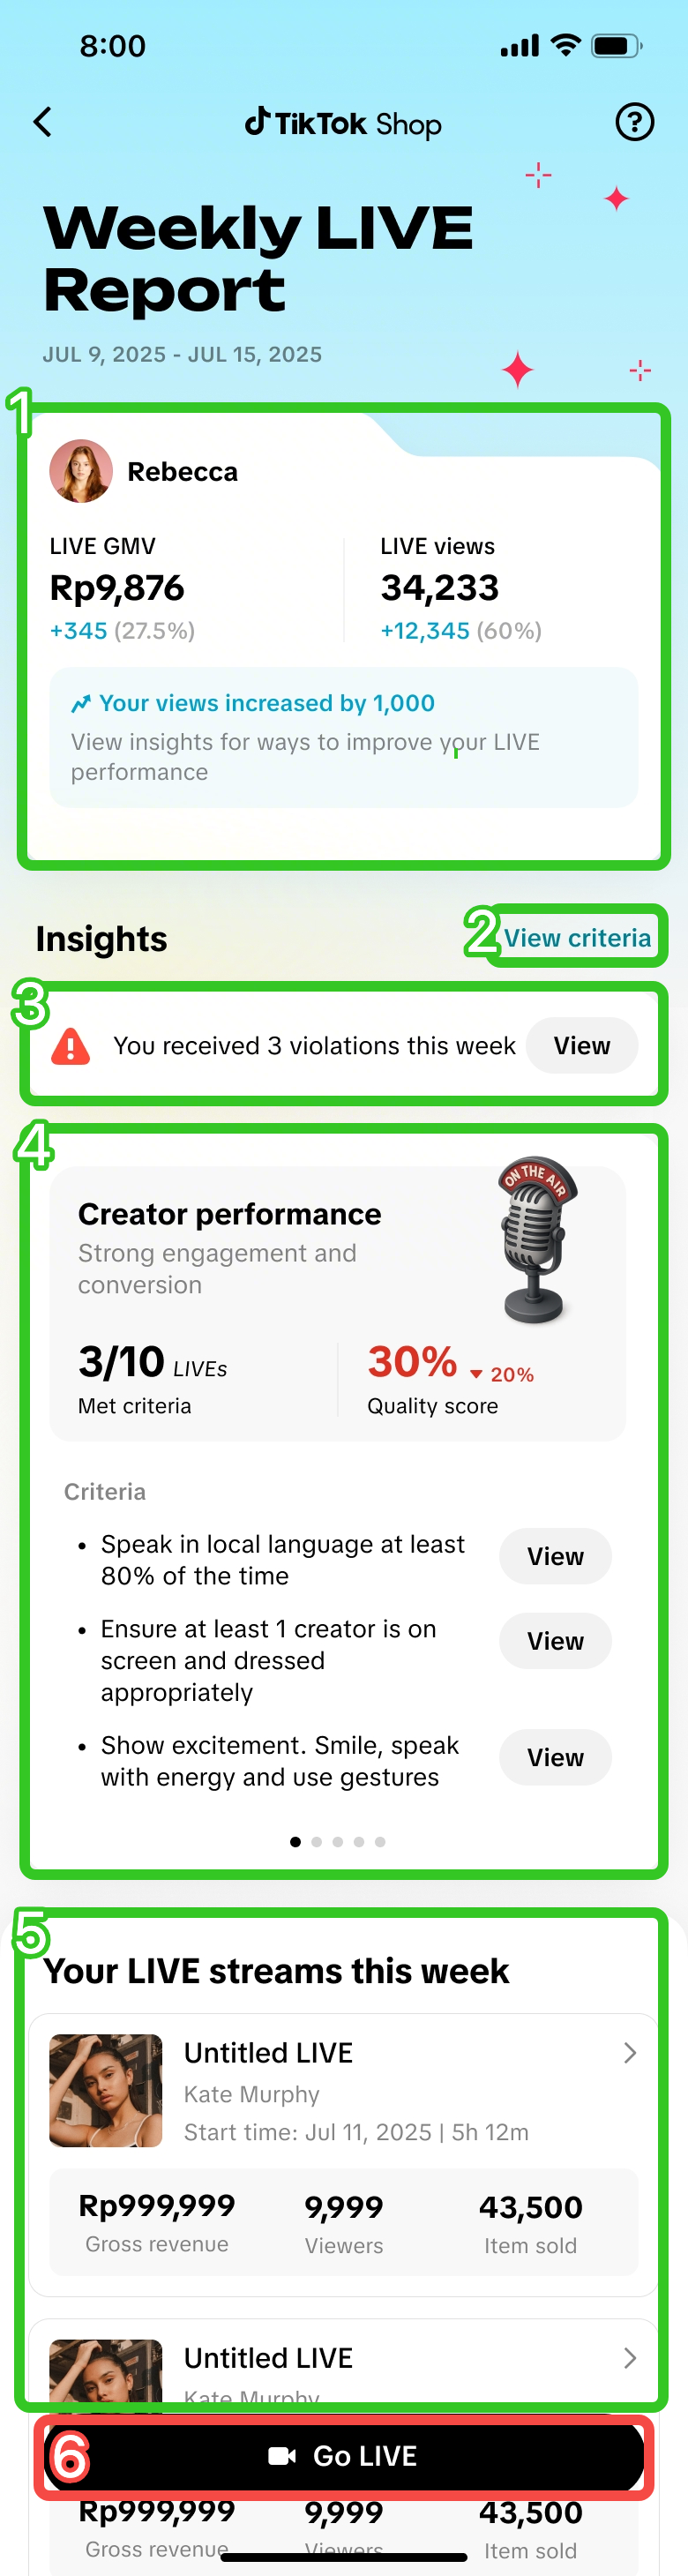
Review Individual LIVE Performance
After reviewing your overall weekly LIVE performance, take a deeper dive into the performance of each individual live room. On the Weekly LIVE Insights report page, navigate to your list of livestreams for the week and click on one to open the LIVE details page.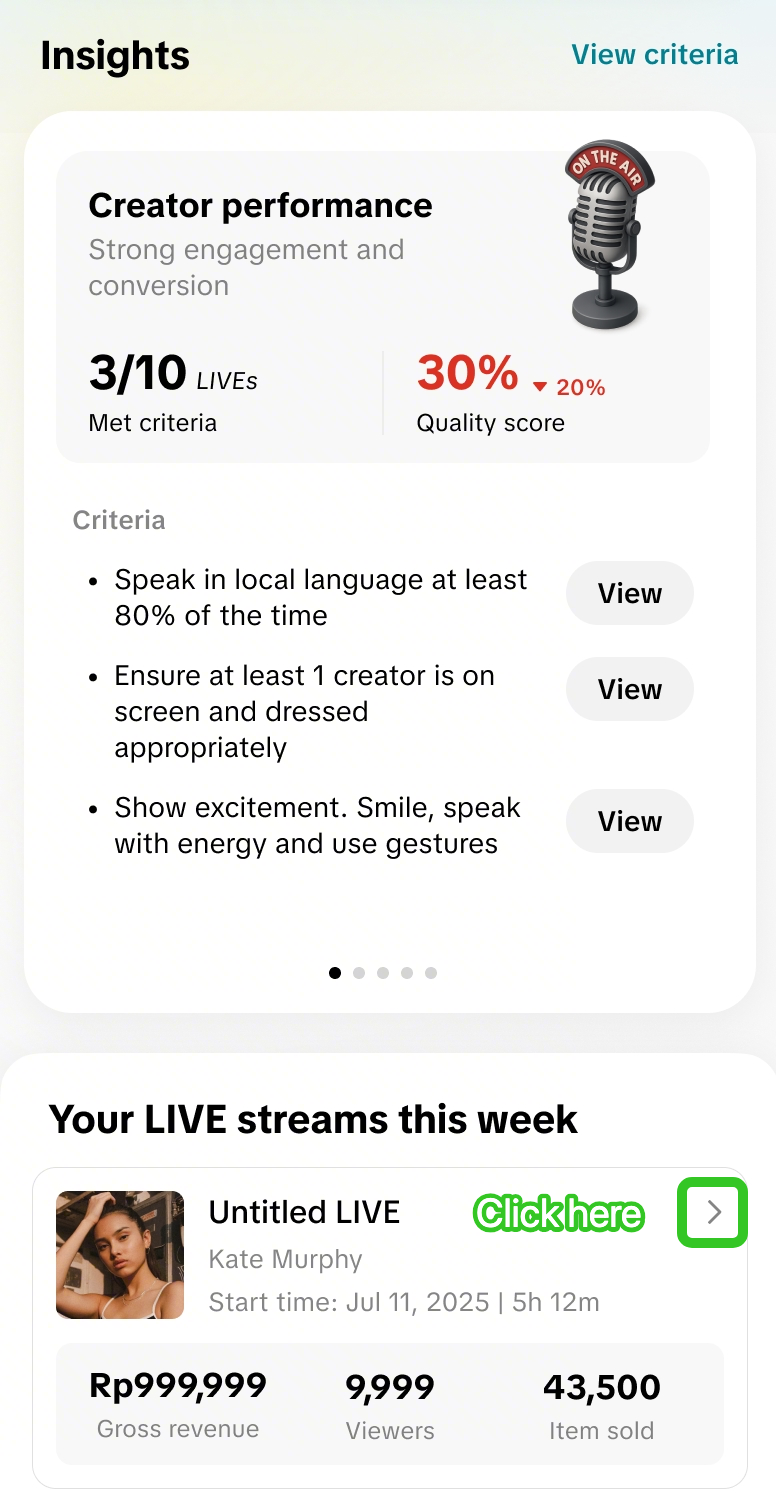 Weekly LIVE Report homepage > Your LIVE streams this week | 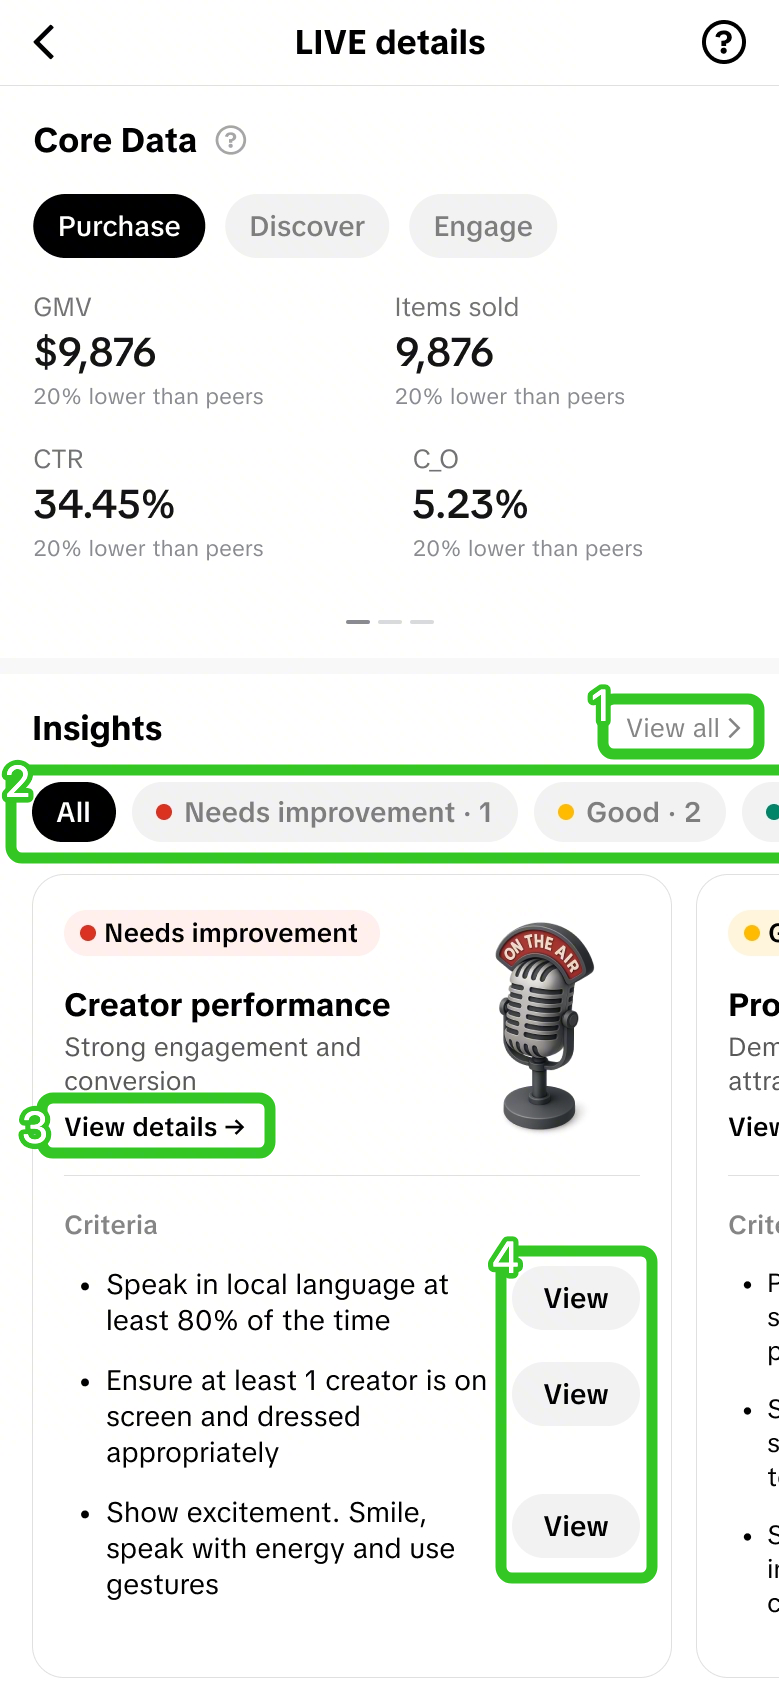 LIVE details page > Insights |
|
| ||
| ||
|
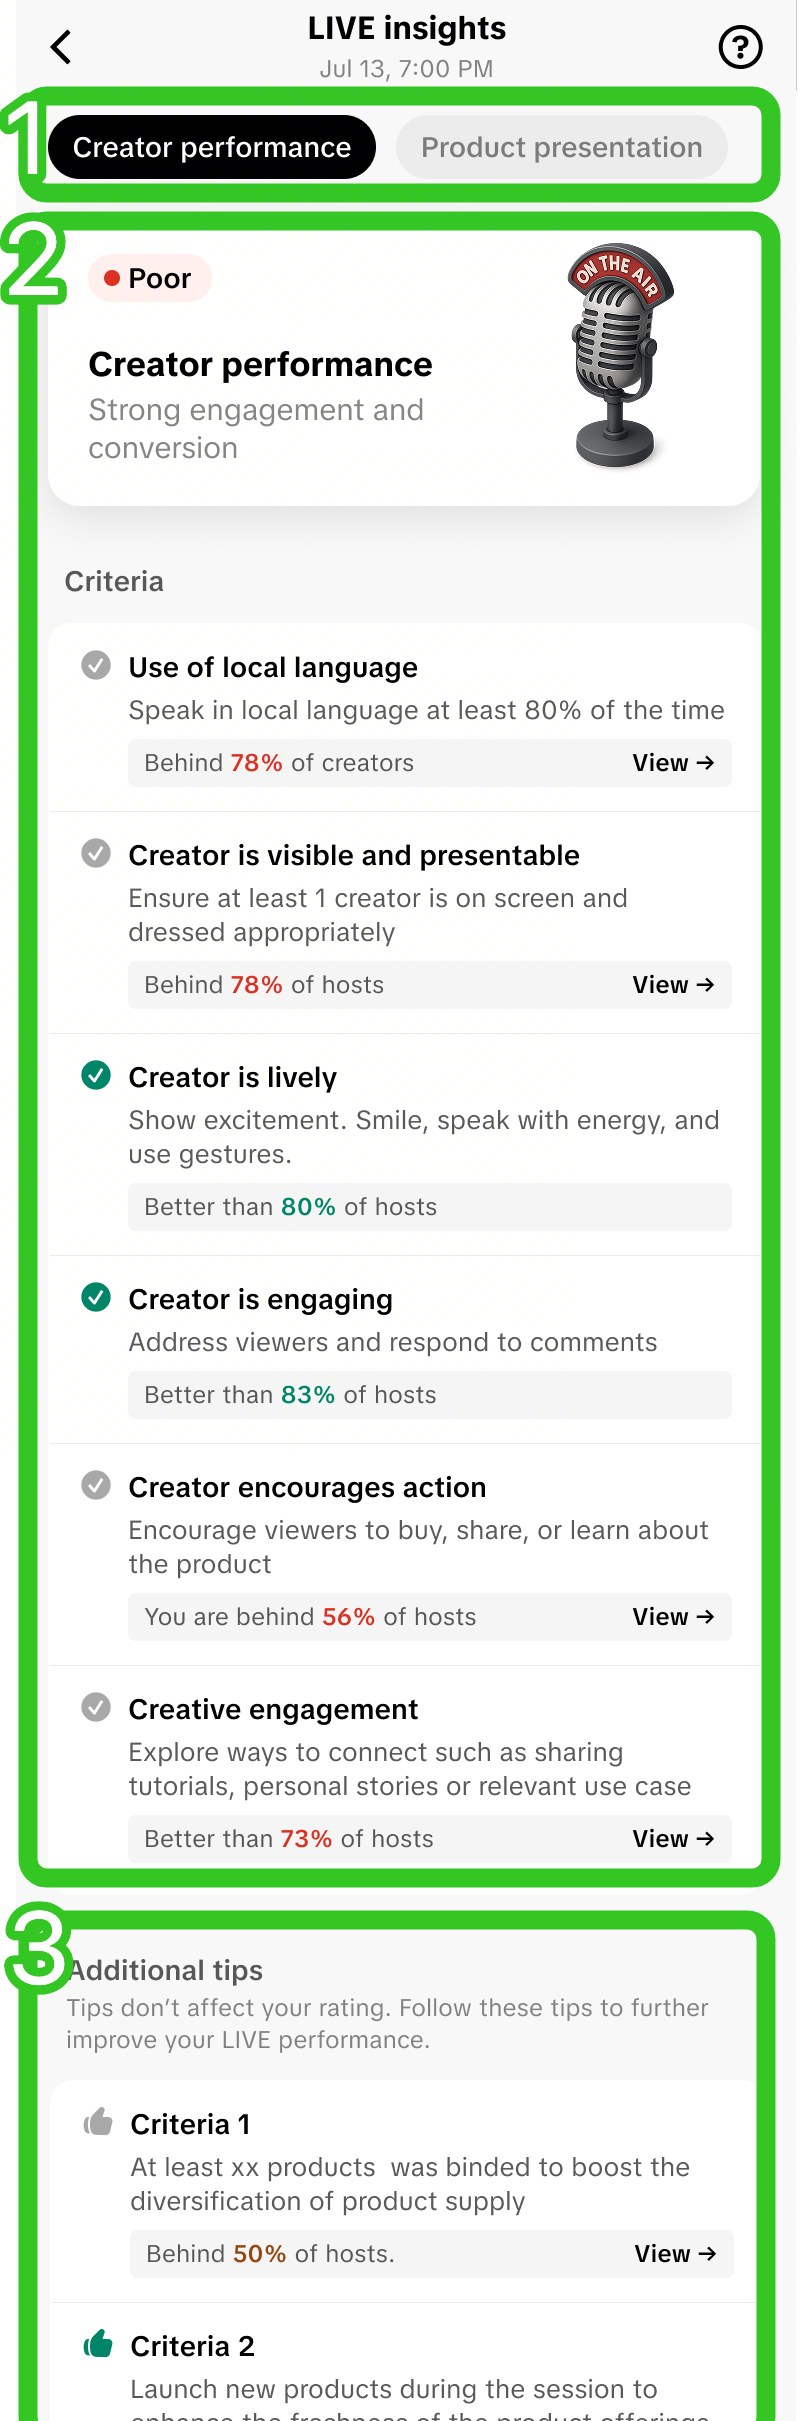 | LIVE Insights page
|
FAQs
- Is the Weekly LIVE Insights report downloadable?
- Can I access Weekly LIVE Insights report via PC?
- What is the definition of LIVE GMV and LIVE Views displayed on the Weekly LIVE Insights report?
- LIVE GMV = The total amount paid for orders placed directly from the LIVE, including returns and refunds.
- LIVE Views = The total number of views of the LIVE, from audiences actually entering the Shoppable LIVE room, by clicking in from different traffic channels.
- I customised the data timeframe to last 30 days, but certain weeks have no reports generated. Why is that?
- There were no livestreams completed during that weekly timeframe
- There were no livestream data generated during the livestreams in that week, e.g. Due to short livestreaming duration, the data was not sufficient to generate a report.
- How is the Quality Score calculated?
| Description | Quality Criteria: Creator Performance | Quality Criteria: Product presentation |
| No. of livestreams completed in 1 week | 10 livestreams | |
| No. of livestreams that fall under "Needs Improvement" | 1 livestreams | 2 livestreams |
| No. of livestreams that fall under "Good" | 2 livestreams | 3 livestreams |
| No. of livestreams that fall under "Excellent" | 7 livestreams | 5 livestreams |
| Quality Score | 7 / 10 = 70% | 5 / 10 = 50% |
- When the criteria displays "Behind X% of creators" or "Better than X% of creators", how is this measured?