Understanding your business performance
01/19/2024
OverviewLearn how to utilize Data Compass features to understand real-time information about your store's sales funnel performance and trends for various time frames. In this material, you will learn about:
 *Note: The picture is an example from a dummy test account.
Trends allow you to overview live data for the same day and various time frames. See more store performance trends:
Revenue Analytics shows the proportion of total revenue of your store, revenue from owned media, and revenue from affiliate.
Affiliate Data shows the top 3 creators by revenue. Each will display total revenue, estimated commission, and followers. You can click Creator analytics to view more data.
 *Note: The picture is an example from a dummy test account.
Affiliate Data to overview revenue from all streams by creators and much more data:
Livestream Details to view detailed live streaming data and set analysis metrics as needed, maximum 5 metrics.
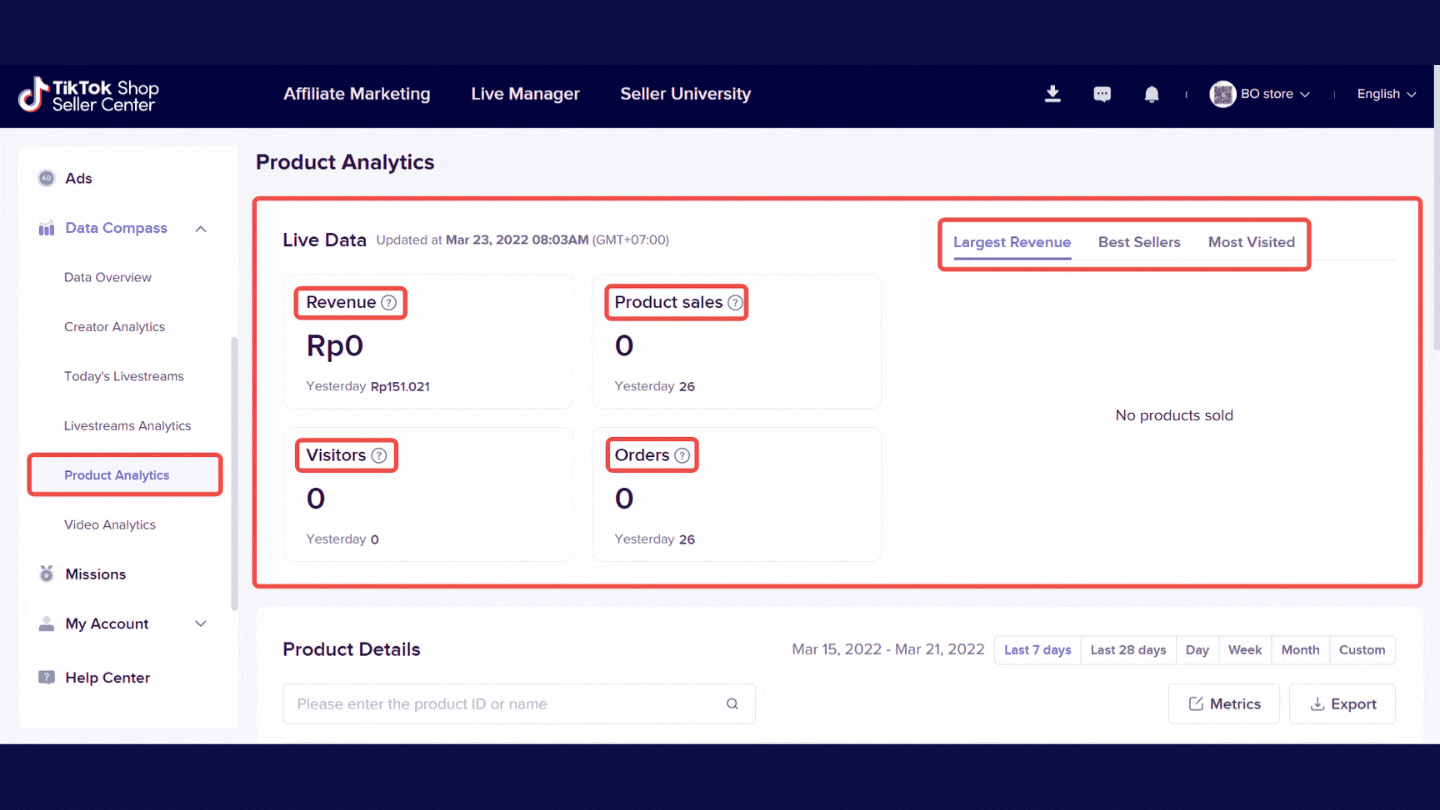 Live Data to view all product performance on that day, which includes:
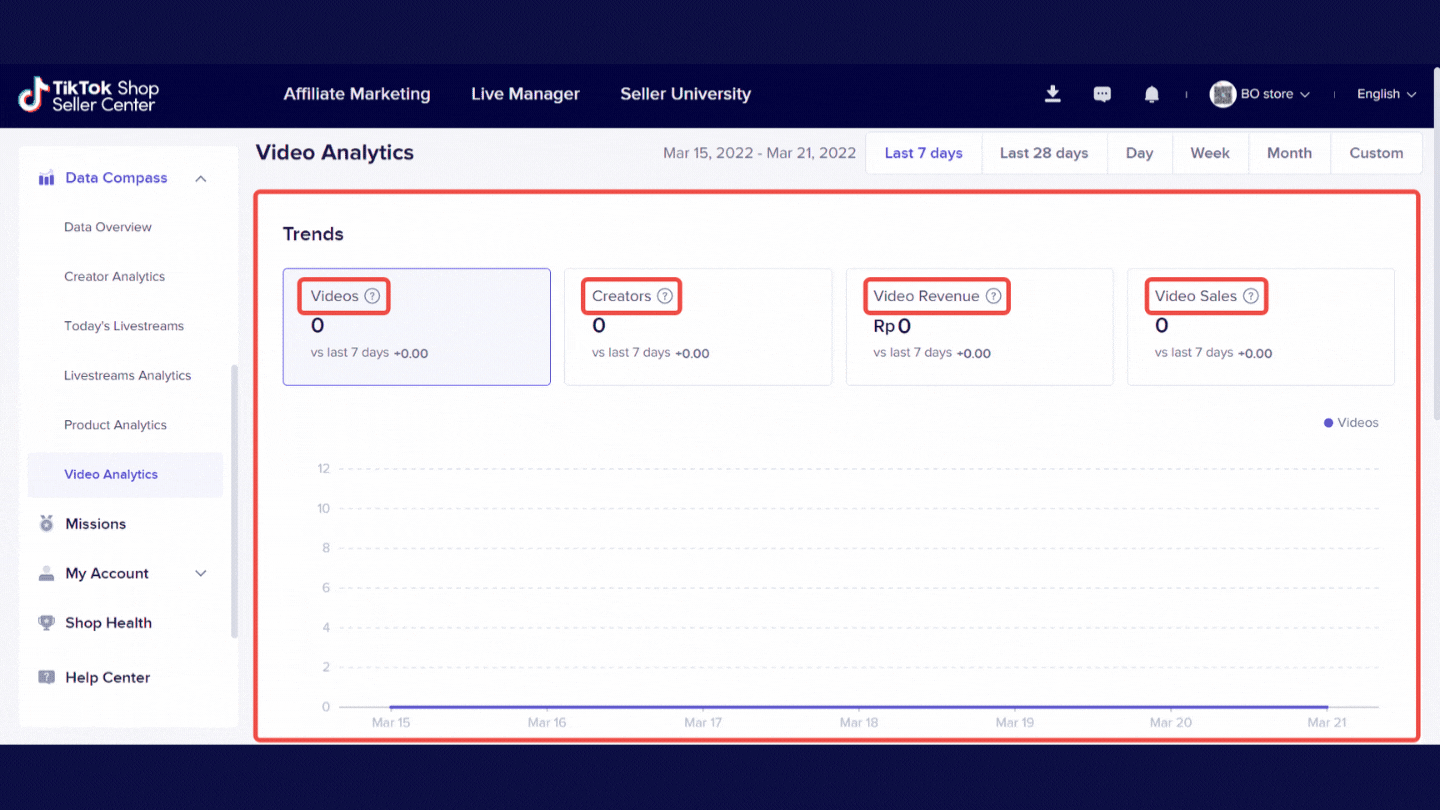 Trends to overview and analyze all videos containing your products from all accounts, which includes:
Video Details to custom metrics information of each of your videos from all accounts, by filtering deal and traffic metrics.
- Understanding trends and identifying insights through historical data
- Looking into product level data
- Understand sales metrics from livestreams and short video
- Monitor your performance
- SKU (Stock Keeping Unit) : Product classification units are issued according to differences in 1 product code with color, size, weight, width, length, flavor, brand, model, etc., for the purpose of tracking products in the warehouse
- SPU (Standard Product Unit): Basic product information or properties shared by SKU of the same product. All products must have an SPU to display the product specifications
- GMV (Gross Merchandize Volume) : Total online product sales calculated from the number of items sold multiplied by the selling price
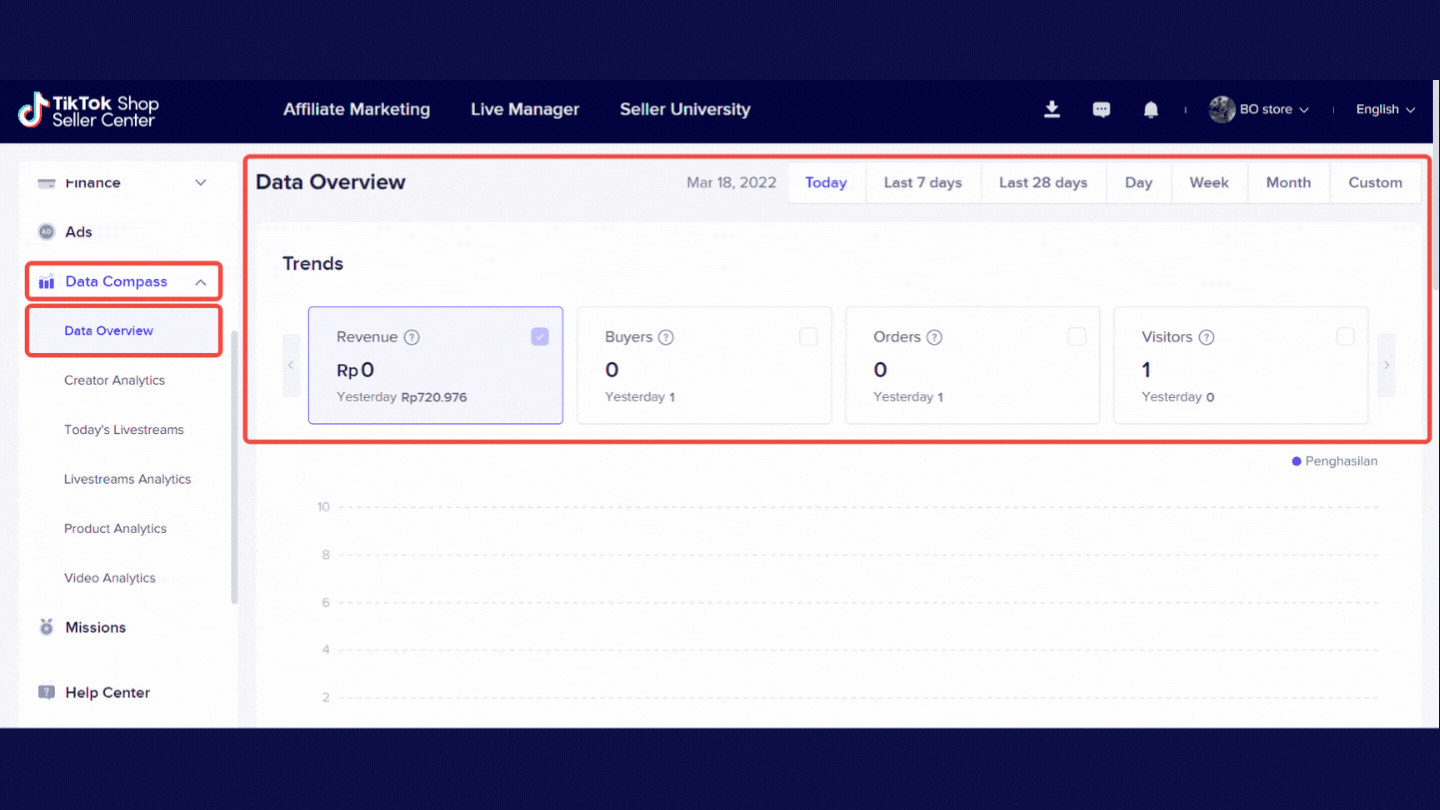
Data overview
*Note: The picture is an example from a dummy test account.Trends allow you to overview live data for the same day and various time frames. See more store performance trends:
- Revenue: The amount of orders paid
- Buyers: The number of unique customers who placed an order.
- Orders: The number of orders placed (by SKU), including refunded orders.
- Visitors: The total number of unique users who visited the seller’s products detail page.
Revenue Analytics shows the proportion of total revenue of your store, revenue from owned media, and revenue from affiliate.
Affiliate Data shows the top 3 creators by revenue. Each will display total revenue, estimated commission, and followers. You can click Creator analytics to view more data.
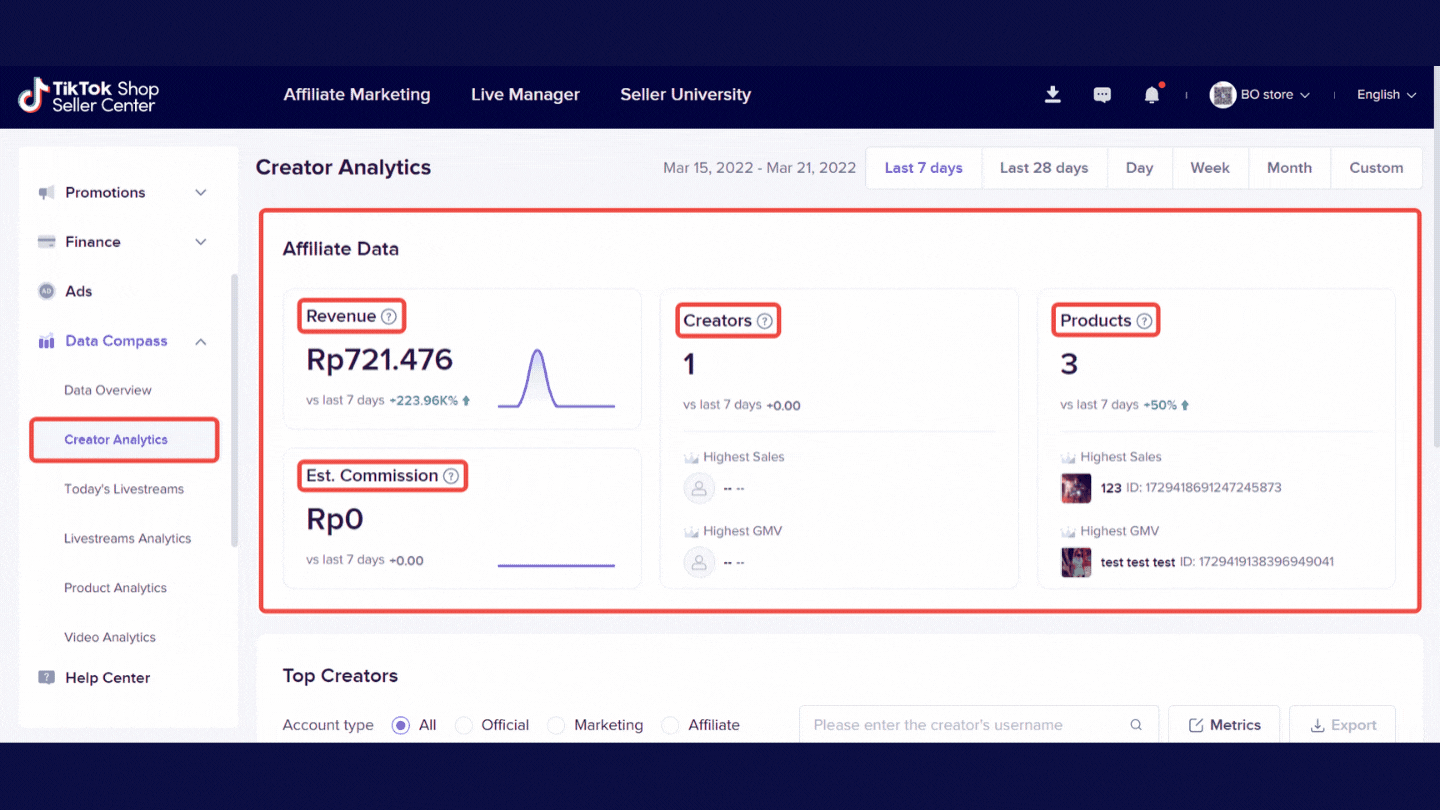
Creator analytics
*Note: The picture is an example from a dummy test account.Affiliate Data to overview revenue from all streams by creators and much more data:
- Revenue: Total amount paid for products sold via Affiliate.
- Creators: The number of creators making sales.
- Products: The number of SPUs sold via Affiliate.
- Est. Commission: The estimated commission paid to creators.
- Creators with highest GMV and orders: the number of creators with the highest number of transactions.
- Products with the highest GMV and orders: the product that contributed the most to GMV.
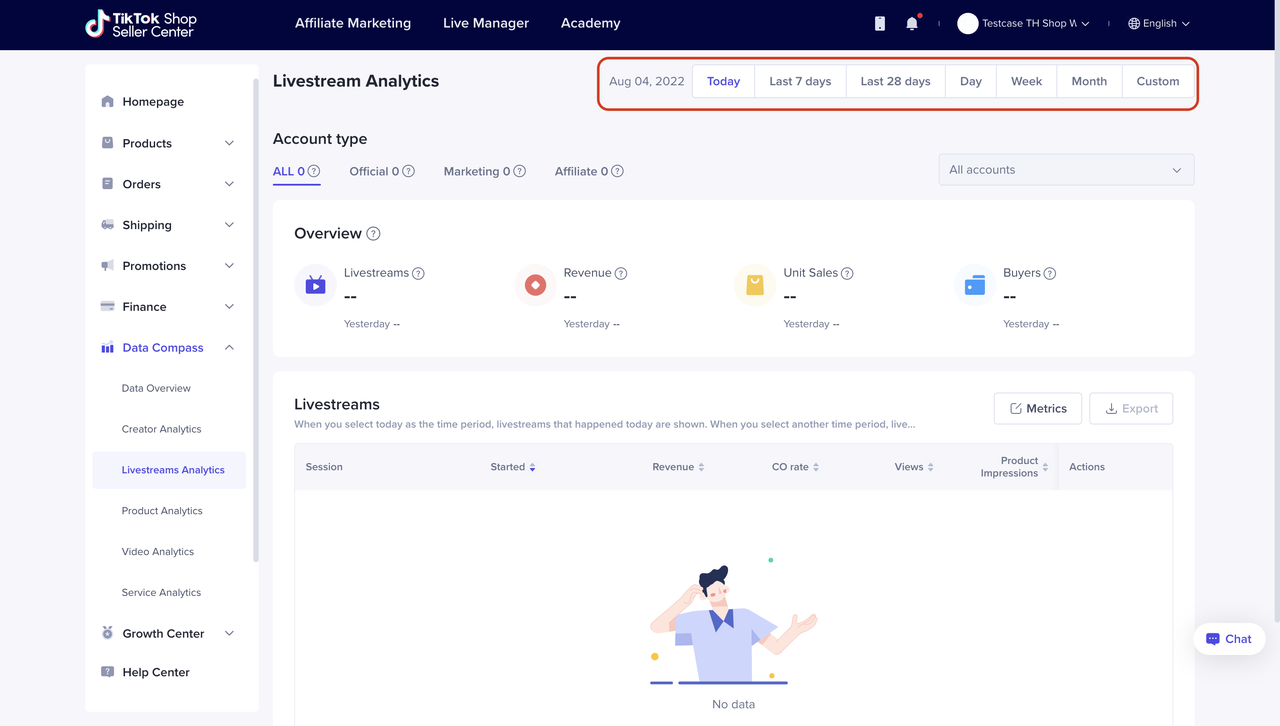
Livestream analytics
- You are able to view today's livestream, the livestream on the last 7 days, 28 days, or custom it by your own.
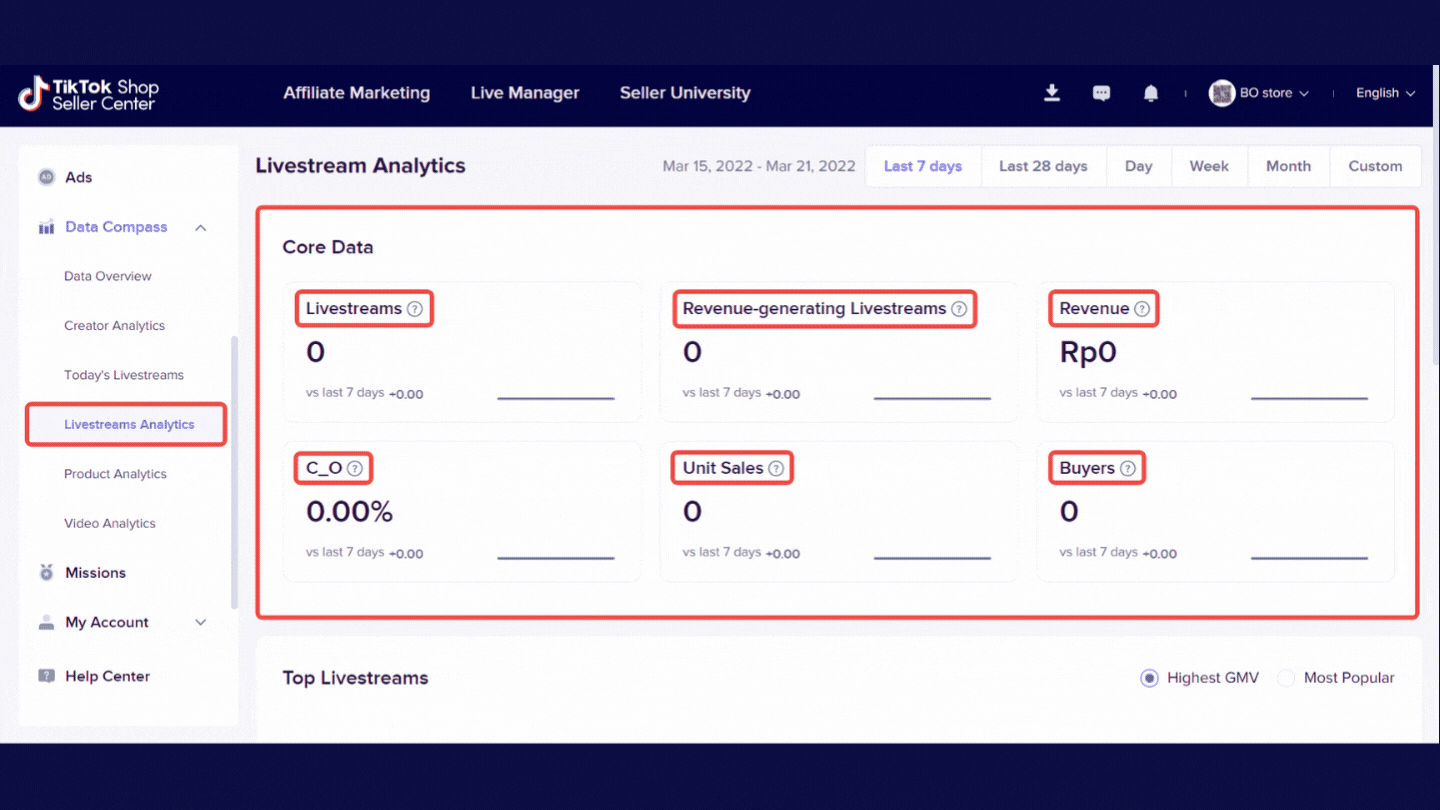
Core Data to analyze all existing Live Streaming data, including live streaming that was carried out before today:
- Livestreams: The number of livestreams within the selected period.
- Revenue-generating Livestreams: The number of livestreams that resulted in revenue.
- Revenue: The cumulative amount paid for orders made from livestreams, including returns and refunds.
- C_O: orders / product clicks via livestream channel.
- Unit Sales: The cumulative number of products sold from livestreams.
- Buyers: The number of unique users who paid for orders made from livestreams.
Livestream Details to view detailed live streaming data and set analysis metrics as needed, maximum 5 metrics.
Product analytics
Live Data to view all product performance on that day, which includes:- Revenue: The accumulated transaction amount of all the products today.
- Product Sales: The cumulative number of transactions for all products today.
- Visitors: De-duplicate number of visitors to the PDP of all the products.
- Orders: The cumulative number of sku orders for all products today.
Below data will help you understand product data that can help you plan strategies to drive sales for best-selling and less popular products more effectively.
- Largest Revenue: Sorted by the GMV of the products from high to low.
- Best Sellers: Sort the products from high to low by the number of sales.
- Most Visited: Sort by the number of visitors to the product detail page from high to low.
Video analytics
Trends to overview and analyze all videos containing your products from all accounts, which includes: - Videos: The number of videos containing your products, including videos published by official, channel, and affiliate accounts.
- Creators: The number of creators who have posted e-commerce videos for you from all accounts.
- Video Revenue: The cumulative revenue of all videos.
- Video Sales: The cumulative number of products from all videos.
Video Details to custom metrics information of each of your videos from all accounts, by filtering deal and traffic metrics.