

LIVE Performance
12/24/2024
This article teaches you how to use LIVE Performance. Specifically, it will show you how to view your livestream's real-time performance, track ongoing livestreams, view high-performing accounts, and more. By the end of it, you will not only understand your livestreams' performance better, you will also have actionable insights to improve them.
Attention: Please note that the GMV attribution on Seller-related transactions has been changed to Content Type GMV Attributions, this means the tabulation of GMV in such scenarios is 100% based on the three main content types: Product Card, LIVE, and Video.
This change will affect numerous metrics on Data Compass. For clarity, we will be prefixing the affected metrics with the tag "[New Logic]".
Please also note that this change applies to the app version of the affected feature. For example, LIVE Performance across PC and App has also adopted the Content Type GMV Attribution.
For more information, please read the Two-Pager document.
Different calculation logics are used for GMV and traffic efficiency metrics like Views, Viewers, ERR, etc. for seller side & creator side data products to account for the differences in the business nature. Given the below 2 logic differences, associated metrics will be different for the same account across seller vs creator data pages.
Attention: Please note that the GMV attribution on Seller-related transactions has been changed to Content Type GMV Attributions, this means the tabulation of GMV in such scenarios is 100% based on the three main content types: Product Card, LIVE, and Video.
This change will affect numerous metrics on Data Compass. For clarity, we will be prefixing the affected metrics with the tag "[New Logic]".
Please also note that this change applies to the app version of the affected feature. For example, LIVE Performance across PC and App has also adopted the Content Type GMV Attribution.
For more information, please read the Two-Pager document.
Where to View LIVE Performance
- On Data Compass, head to Livestream & Video, LIVE, then click on LIVE Performance from the drop-down menu.
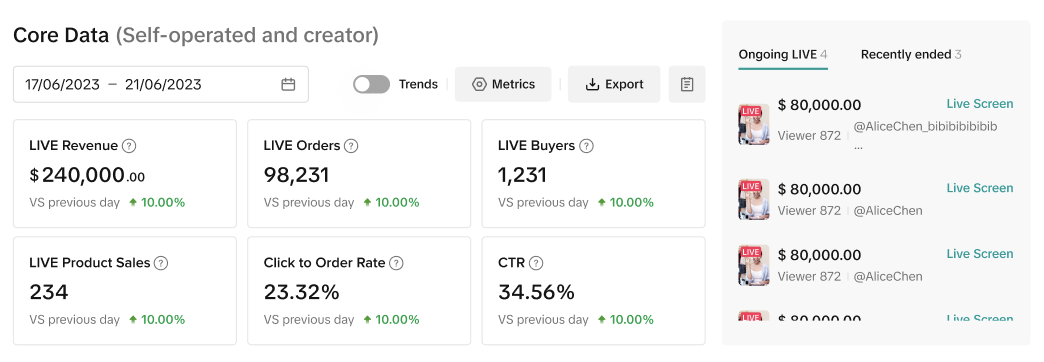
- On the right is a box showing ongoing livestreams and the recently ended ones.
- There are three main tabs here:
- These metrics show the performance of your livestreams in real-time or a selected time period. There are six metrics by default: GMV, Orders, Buyers, Units Sold, CO Rate, and CTR. [New Logic]
- Hover over the ? to view the metrics' definitions.
- You can download the performance and view trend charts.
- You can also subscribe to a different set of six metrics or mix with the default ones. The other metrics include LIVE Views, Avg. Viewing Duration, Livestreams, Show GPM, Revenue-generating Livestreams.
- LIVE Attributed GMV is affected by the [New Logic].
- Note: LIVE Attributed GMV here means the evaluation of the effectiveness of the livestream, which is the orders made within 24 hours of viewing the livestream.
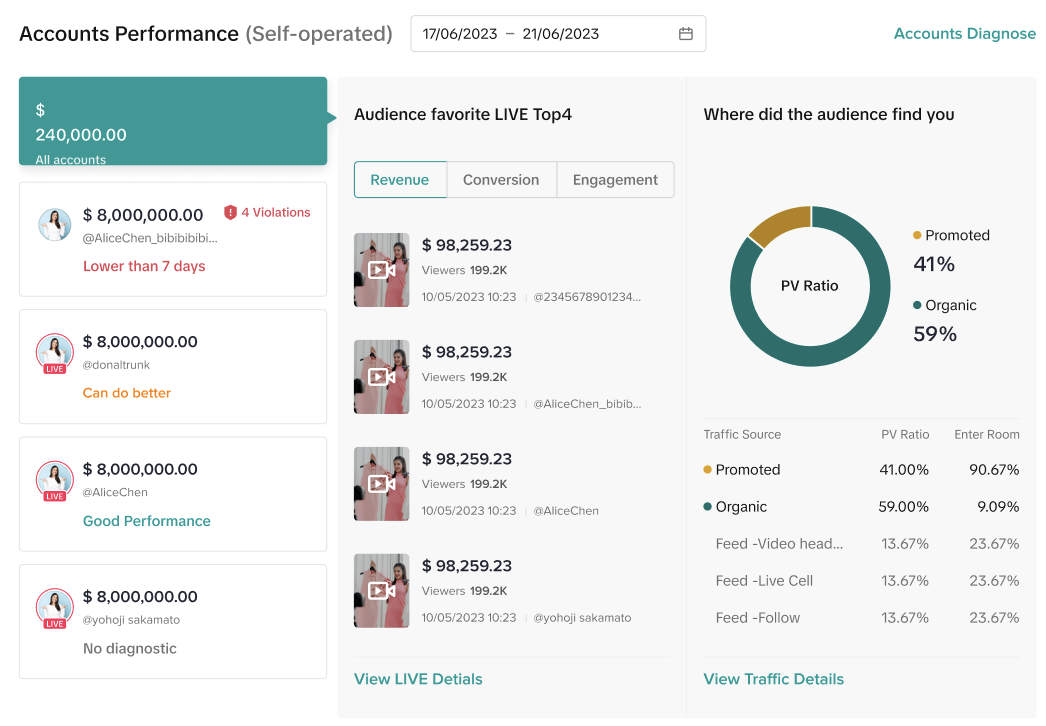
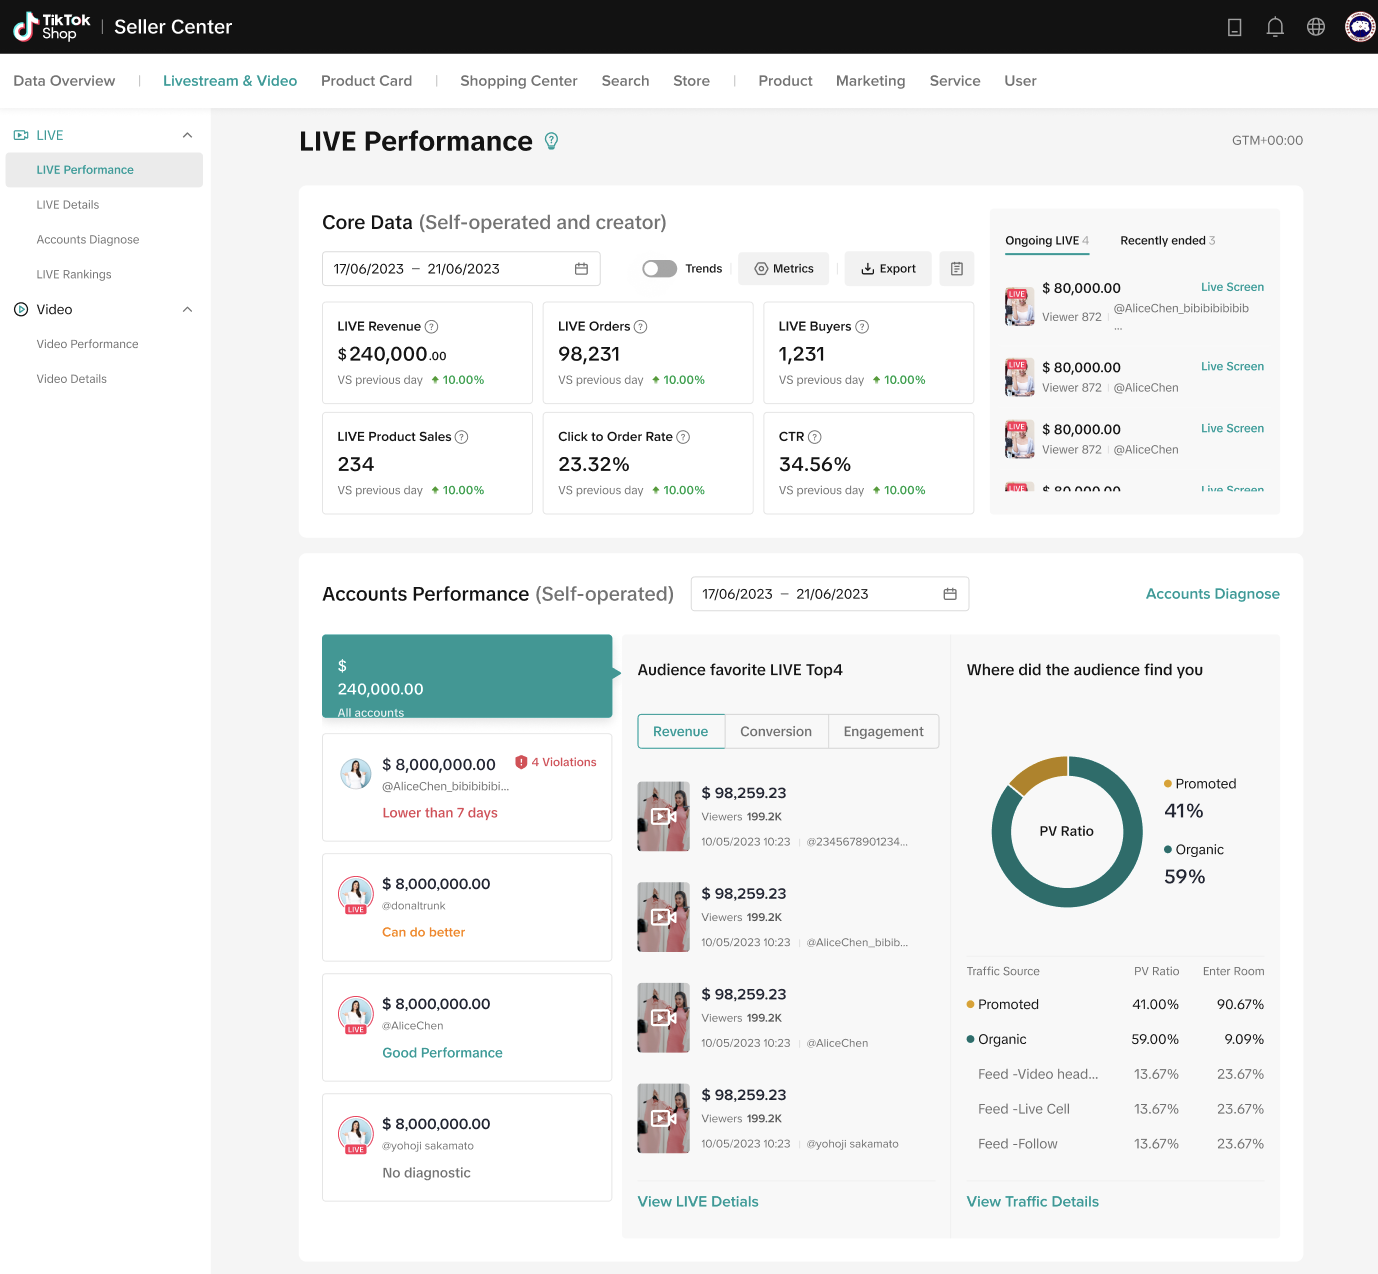
Accounts Performance
- Displays the total or each account's performance data. The time period by default is 7 days, you can change to 1 day or 28 days.
- By default, you will see the performance of all Linked Accounts. To view an individual account, simply hover your mouse over it. Under each account, you will see their TikTok handle, diagnosis conclusion and reasons, and violations. Click on View Diagnosis, bringing you to Live Diagnosis for a closer look at the selected livestream's performance.
- Note: This section only shows your, the Seller's, accounts (1 Official and 4 Marketing). Affiliate accounts are not visible here.
- You will then be able to know the top 4 livestreams audiences love about the account, and this is sorted by GMV, C_O [New Logic]. Click on view LIVE Details for more information
- You can also check where the audience finds your content by different metrics including GMV, Orders, and C_O Rate [New Logic].

Rank Your Livestreams with LIVE Details
- On Data Compass, head to Livestream & Video, LIVE, then click on LIVE Details from the drop-down menu.
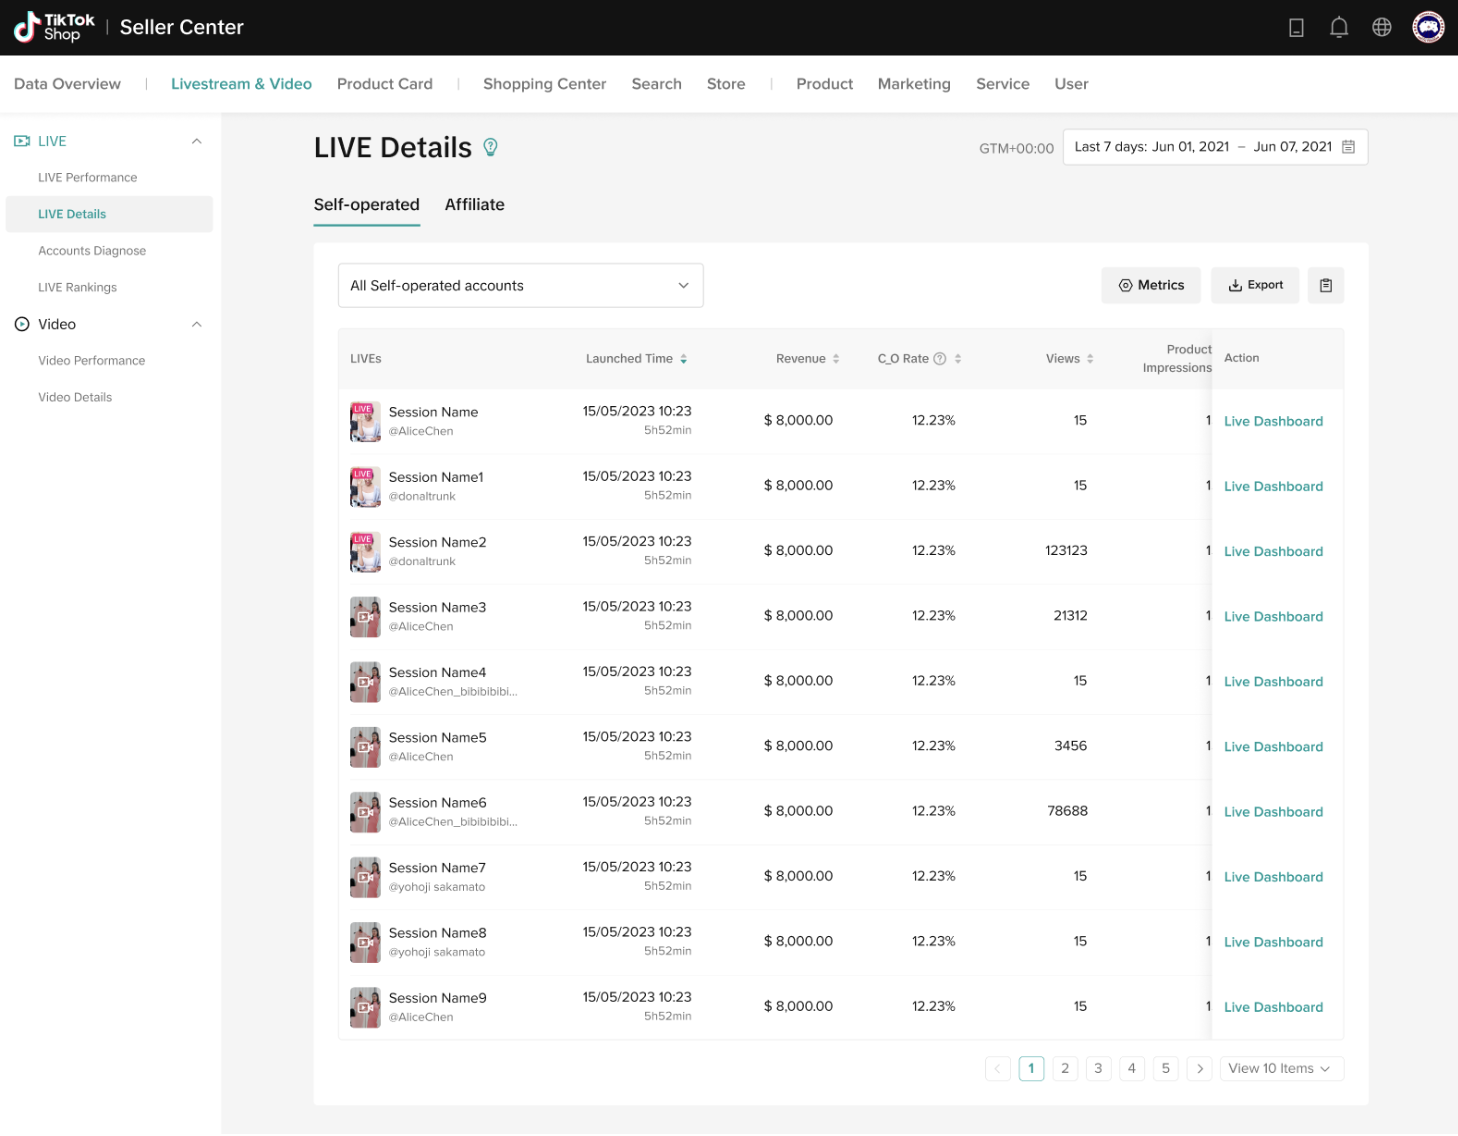
- Here you can view all your livestreams in different settings and time periods. The main tabs are Linked and Affiliate Accounts. And under each tab, you can choose to sort it by metrics and export the data.
- Details such as a livestream's launched time, GMV, C.O Rate, Views, and more are visible. Hover over the ? for definitions.
- These metrics fall under the [New Logic]: Attributed GMV, GMV, C_O, Unit Sold, Buyers, Items Sold, Orders Created, Orders Paid, Average Price, and Different Products Sold.
- Please note that the GMV here tallies with Direct GMV on Creator Analysis.
- For ease of reference, click on Live Dashboard to access the newly upgraded LIVE Board.

Understand What Audiences Love Watching with Livestreams Inspiration
- On Data Compass, head to Livestream & Video, Livestream, then click on Livestream Inspiration from the drop-down menu.
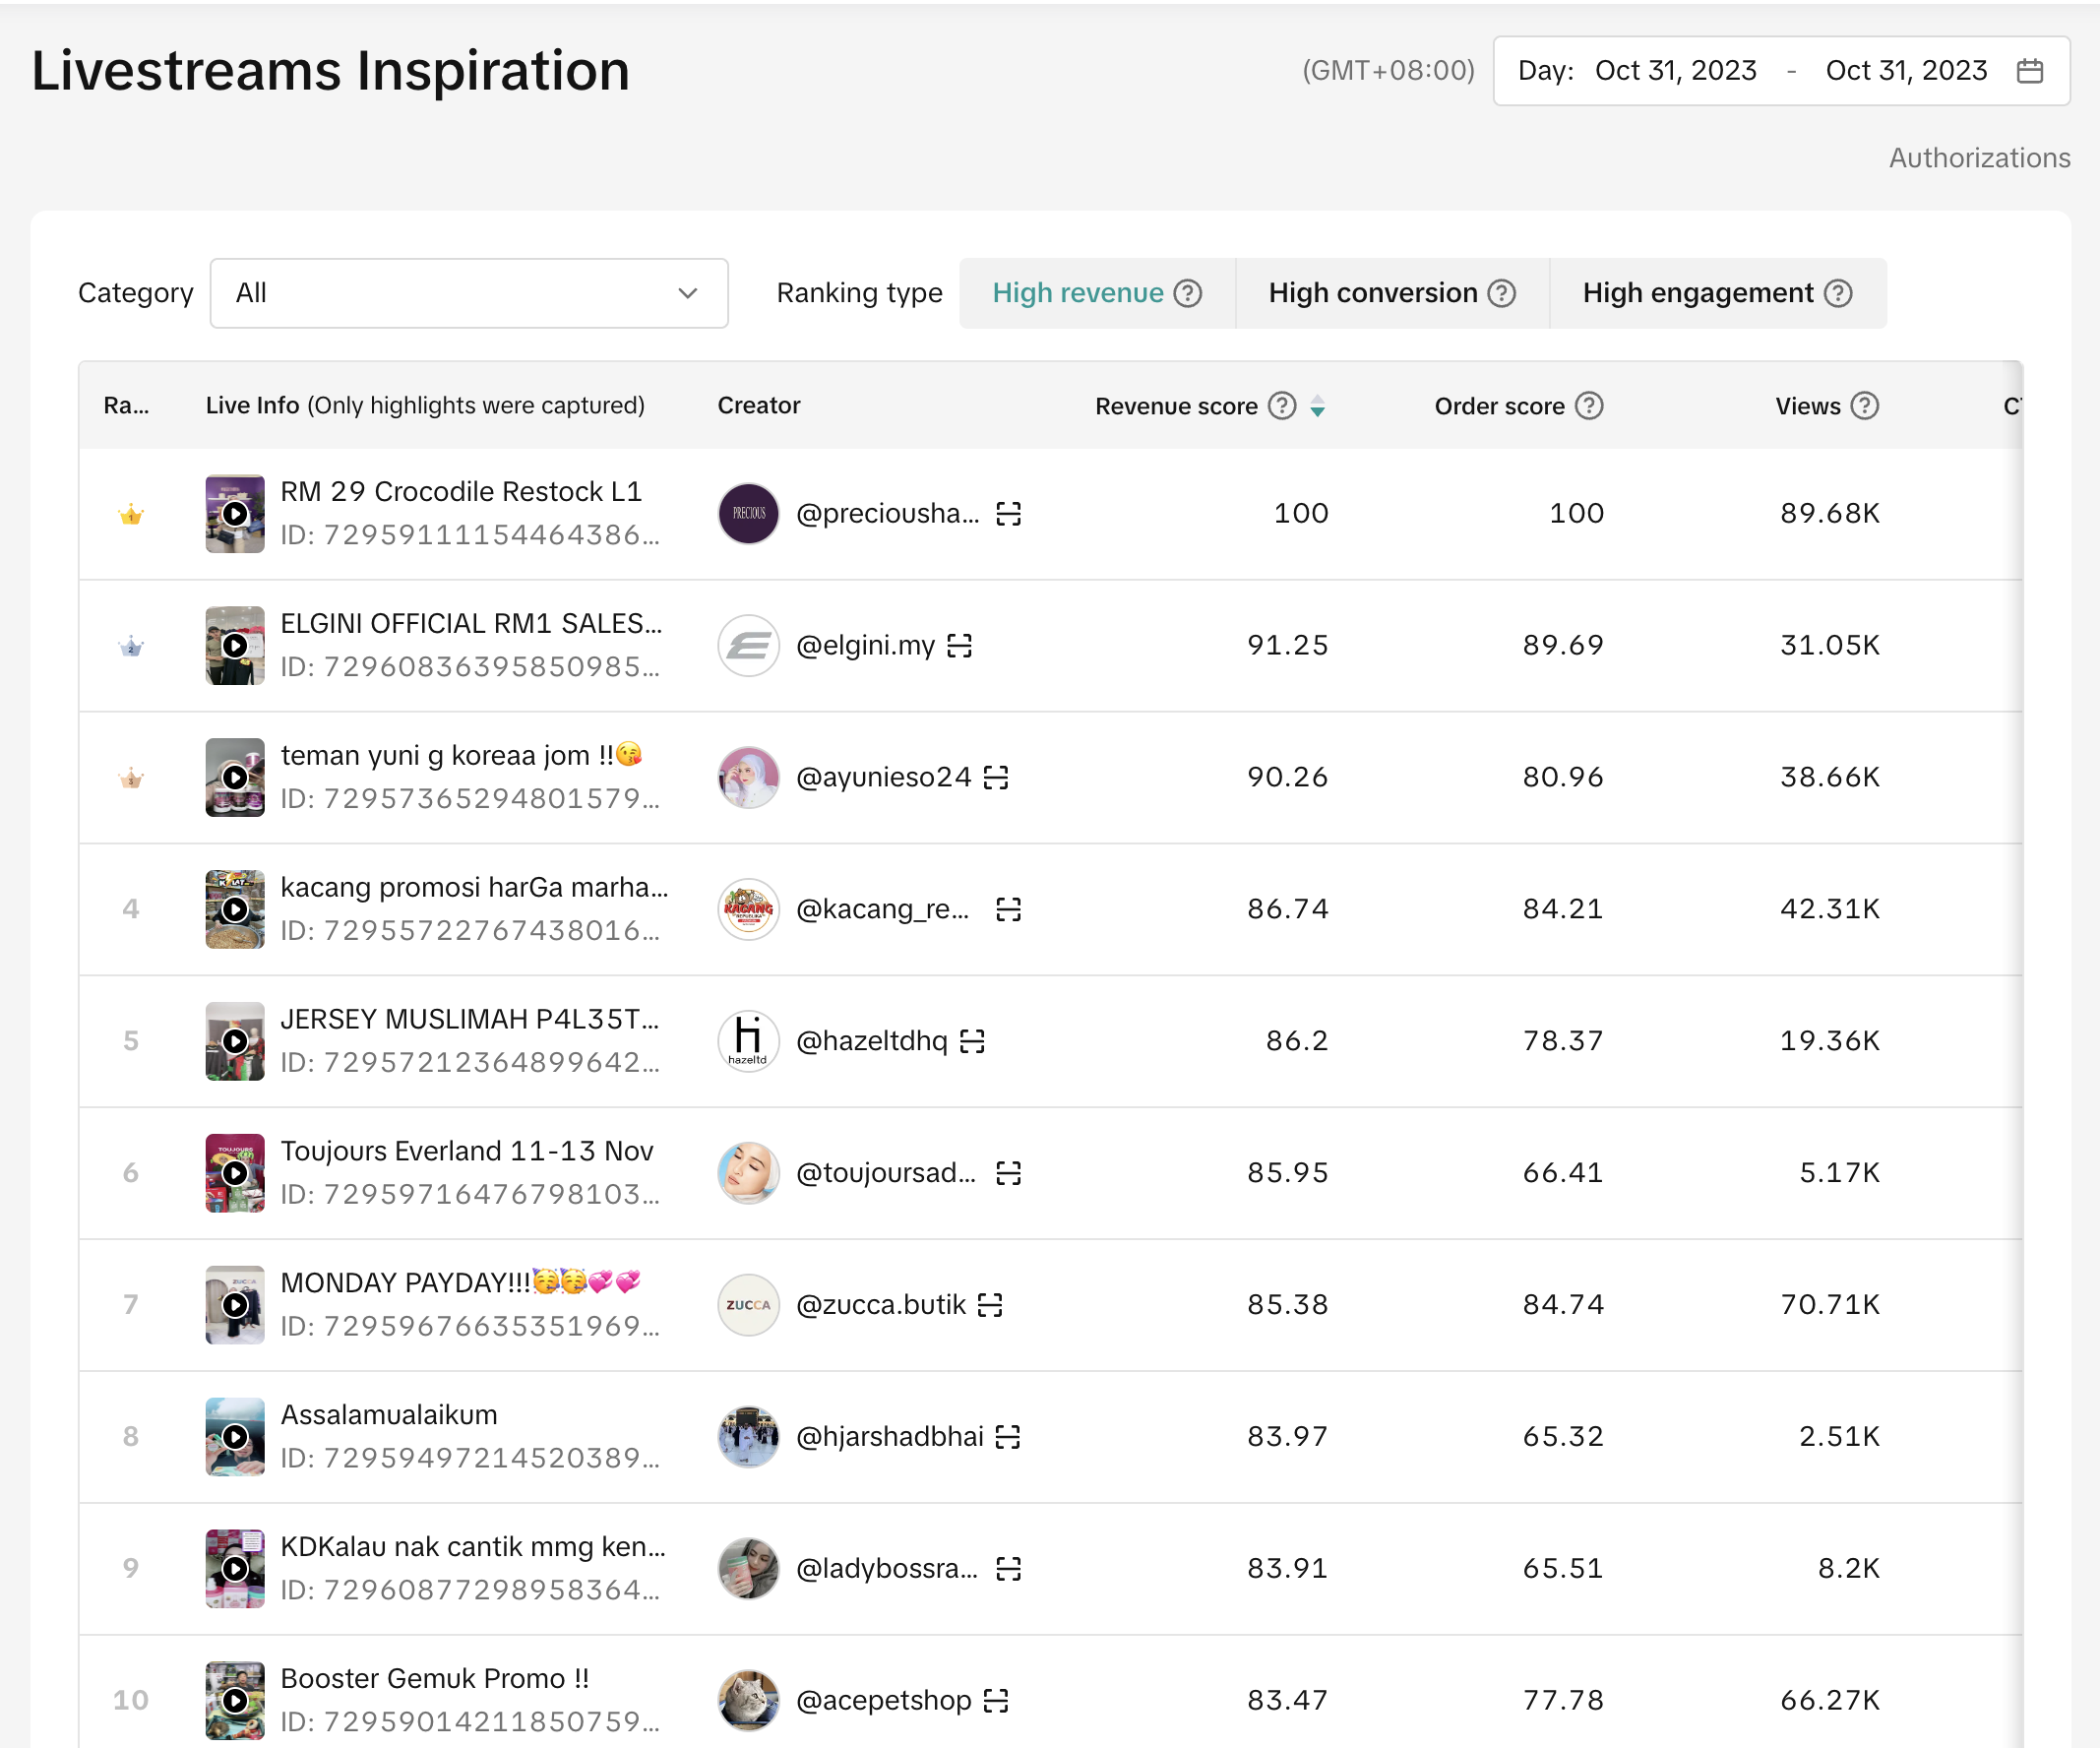
- Sort livestreams by category and ranking type (High revenue, High conversion or High engagement) [New Logic].
- Click on the thumbnail to view the livestream.

Seller Showcase
FAQs
- Where can I view Affiliate Data?
- Affiliate data is available through the LIVE Details page or alternatively, you can access it via Marketing > Affiliate > Creator Analysis. By default the data is real-time. Alternatively, you can also set your preferred time period.
- Why is the data different for the same livestream performance across different platforms such as Seller Center - Lives Performance, Streamer Desktop - Livestream Analytics and Live Board?
Different calculation logics are used for GMV and traffic efficiency metrics like Views, Viewers, ERR, etc. for seller side & creator side data products to account for the differences in the business nature. Given the below 2 logic differences, associated metrics will be different for the same account across seller vs creator data pages.
- GMV Calculation Logic: Seller side has adopted the content type GMV attribution i.e. GMV is attributed to the last clicked content type. For the creator side, GMV is using the commission based attribution logic where attributed GMV from affiliate due to how commission is distributed is accounted for. Taking Live Board as an example, LIVE GMV as shown on seller side will not be equivalent to LIVE GMV on creator side. Instead, it will be the same as Direct LIVE GMV on creator side which reflects the GMV based on content type GMV attribution.
- Traffic Calculation Logic: Seller side takes the operating market as traffic base whereas Creator side considers global market as traffic base.
คุณอาจสนใจ
How to Use Live Diagnosis to Evaluate Account Performance
Live Diagnosis helps to review an account's livestreaming performance The Data Compass for sellers n…

LIVE Dashboard
Are you looking for the solution to tracking your LIVE performance comprehensively, during and after…
Tips for improving livestreams 1.0
Live Traffic Key Factors 1. Important factors affecting livestream GMV The process of users moving f…

LIVE Diagnosis
This article explains LIVE Diagnosis feature overview and how sellers can better prepare for your ne…