

LIVE Traffic Playbook
07/25/2025
Overview
Conducting a successful Shoppable LIVE performance can be daunting and requires juggling various activities, in terms of your performance, at the same time. In addition to individual LIVEs, it can be even more challenging to consistently optimize your performance over multiple LIVE sessions.One of the critical aspects of effective Shoppable LIVE performance is understanding audience traffic during your LIVEs. This ranges from looking at how many audiences are viewing your LIVEs, entering your LIVEs, exploring and buying your products and quite a few things in between.
This Traffic Playbook is intended to be a guiding resource for you to understand:
- What constitutes traffic analytics
- The data insights that you should be looking at
- The tools that allow you to do so
- Best practice guidance in terms of analyzing traffic
- And the measures you can take to positively influence traffic

Value proposition of traffic analytics and key principles
Value proposition
Similar to how an effective LIVE setup, preparation, product scripts and product selection process are key elements of a successful LIVE-stream, being able to understand, analyze and optimize your traffic to generate visibility, create interest, foster engagement and finally being able to convert your LIVE viewers into purchasers, are just as key elements in your LIVE methodology. This latter aspect of nurturing your audiences towards conversion and understanding the underlying tactics and means to do so constitutes effective traffic analytics for your Shoppable LIVEs.Effective traffic analytics enables you to:
- Understand the channels driving organic traffic into your LIVEs: Understanding the various sources from audiences are discovering and entering your Shoppable LIVE room, provides you with the data insights required to ensure that the most relevant people are always finding out about your ongoing LIVEs and that they are engaging with/purchasing from the LIVE.
- Understand the trends and variations for essential metrics to unearth insights: Once people are in your LIVE room, understanding the different engagement and purchase patterns helps you:
- Understand when your LIVE is performing well or poorly
- Take the necessary steps to optimize your strategy in real-time or in post-mortem
- Discover a simple yet effective mechanism for consistent traffic analytics: Apart from understanding the essential traffic indicators, this playbook will help you explore and internalize optimal strategies for consistent traffic analytics
Key principles
Please refer to this diagram below denoting the key steps, data insights and trajectory of effective traffic analytics.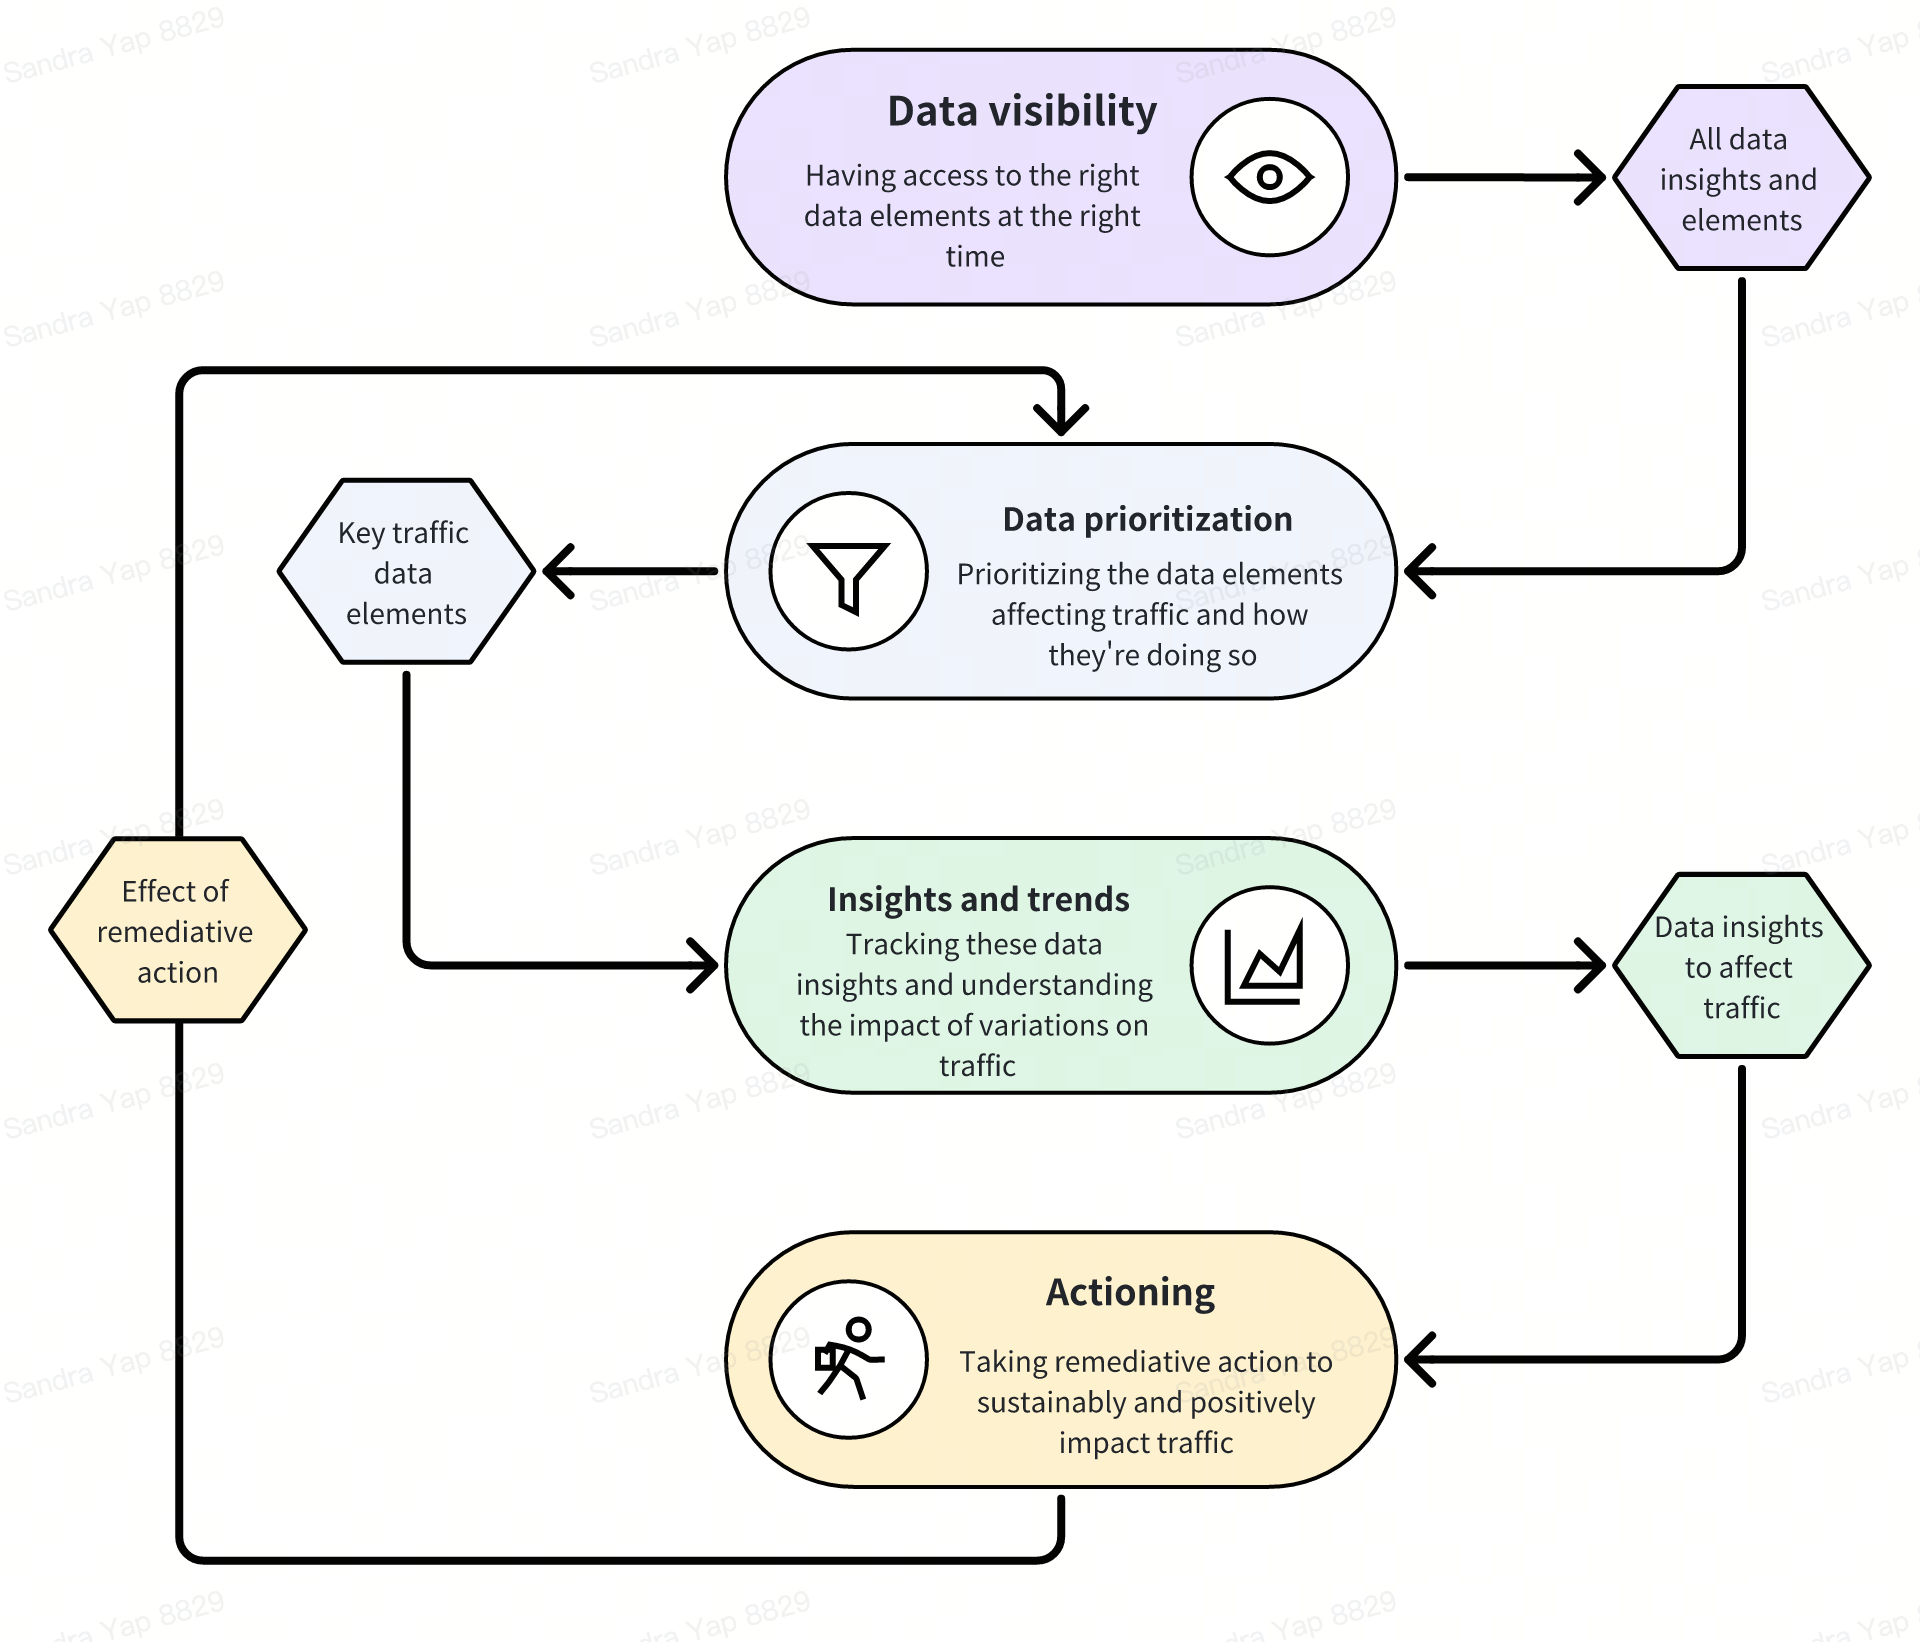

Critical traffic impacting metrics
Before analyzing broadly the ways to track traffic analytics, it's important to identify and understand the key data points that constitute the overall performance of your LIVE traffic. We will use this section to dive into these critical metrics and share what those mean.It's helpful to look at "LIVE Data metrics", especially the ones that are critical indicators of LIVE traffic, along three dimensions:
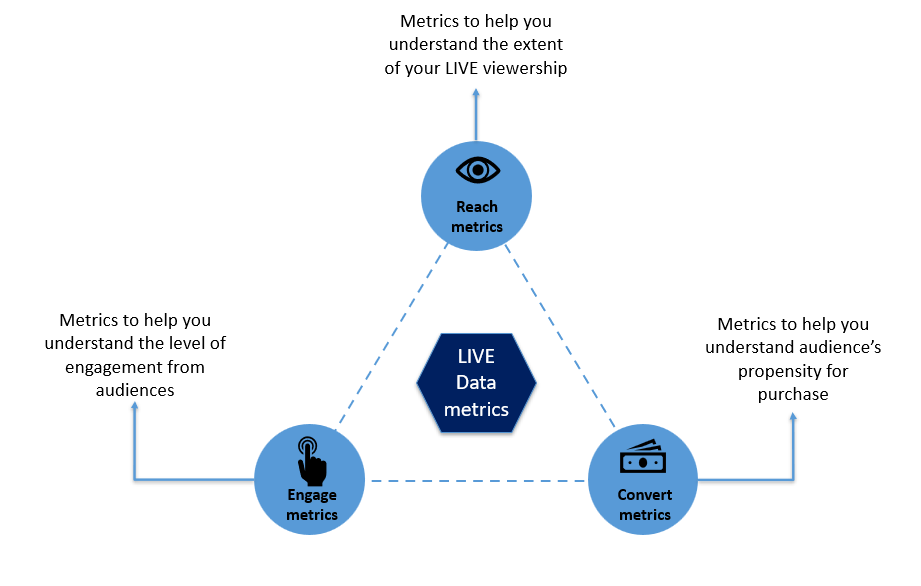 Let's have a deeper look into what the various metrics in each category mean and how they contribute to effective traffic.
| Dimension | Metric | Metrics definitions (and examples) | Additional remarks |
Reach | Impressions | The number of times the LIVE is displayed to audiences in their FYP | While it's important to track both views and impressions of your LIVE room, robust impressions are a better indicator of more optimized traffic performance as it signifies your ability to position and promote the LIVE on the right channels. |
| Views | The number of views of the LIVE, from audiences actually entering the Shoppable LIVE room, by clicking in from different traffic channels | ||
| Viewers | The number of distinct viewers, during the course of the LIVE | - | |
| Average viewing duration | The average viewing duration for "viewers" in the LIVE. | A higher average watch duration signifies better retention for your audiences, which increases the potential for better engagement and conversion. | |
| Enter Room rate (ERR) | The proportion of views as compared to the number of impressions of the LIVE room.=(# views/# impressions) * 100%Note: The ERR is basically #views/#impressions and signifies the fraction of impressions who see your LIVE from various traffic sources, that come into and join your LIVE room, to make a potential purchase. | A 100% ERR (which is extremely rare) means you are effectively driving everyone that views your LIVE, into your LIVE room. | |
| Impressions per hour | The average number of LIVE impressions per hour duration of the LIVE room. | - | |
Engage | Comment rate | Number of comments (including comments from same viewers) per total views of the stream= # comments/# of views | - |
| Follow rate | Number of new follows per total views of the stream= # new follows/# of views | - | |
| Share rate | Number of times the LIVE is shared during the LIVE stream per views of the stream= # shares/# of views | - | |
| Like rate | Number of likes for the LIVE per views of the stream= # likes/# of views | - | |
Convert | Clickthrough rate (CTR) | LIVE Clickthrough rate (CTR) denotes the efficiency of converting product views into product clicks=(# of product clicks/LIVE Views) * 100% | - |
| Click-to-order rate (CTOR) | LIVE Click-to-order rate (CTOR) denotes the efficiency of converting product clicks into product orders=(# of SKU Orders/Product clicks) * 100% | - | |
| Show GPM | The Show GPM (GMV per millie) is the amount of GMV generated from the LIVE room per 1000 impressions of the LIVE. The metric scales the ability to generate GMV across impressions of the LIVE room=(LIVE Room GMV/ # of impressions in 1000s) | While it's important to track both Show GPM and Watch GPM of your LIVE room, a high value of Show GPM is a better indicator of more optimized traffic conversion, similar to how impressions are a better indicator of LIVE traffic performance as compared to views. | |
| Watch GPM | The Watch GPM (GMV per millie) is the amount of GMV generated from the LIVE room per 1000 views of the LIVE. The metric scales the ability to generate GMV across views of the LIVE room=(LIVE Room GMV/ # of views in 1000s) |

Recommended traffic analytics guidelines and strategies
The cadence of analyzing traffic for your LIVEs and taking measures to understand patterns and take action will vary based on your level of experience in Shoppable LIVEs, the tools and the platforms you're using and the team/agency that may be assisting you. In general, this section provides certain guidelines that will be beneficial for Creators and Sellers to understand their traffic performance and systematically improve it.GET TO KNOW THE TOOLS AT A GLIMPSE
Before we dive into specific strategies for traffic analytics, let's get a bird's eye level look at the tools available to optimize traffic.
We will look at specific use cases for each of these tools in detail, in a later section- LIVE Dashboard: The LIVE dashboard is your central tool for all analytics and data insights. Use the dashboard to track all key aspects of analytics to make informed decisions. We will discuss the Dashboard in-depth in this document.
- LIVE Flash Sales: Flash sales provide price incentives for your products to your audiences. Use these to boost sales volume through price incentivization.
- LIVE Manager: The LIVE Manager enables end-to-end management of all LIVE activities and tracking audience activity, all from one convenient location.
- LIVE Pin: Pinning products enables quick and easy visibility of your flagship products, driving traffic into your LIVE and aiding conversion for audiences in your LIVE
- LIVE Events: Events are a great way to organize and promote your LIVEs in advance, to ensure early awareness for your audiences.
4.1 Understand deviations in your key LIVE Metrics
| Analyze key LIVE metrics | Recommended analysis timeframe | Where to look | Recommended Analysis Guidelines |
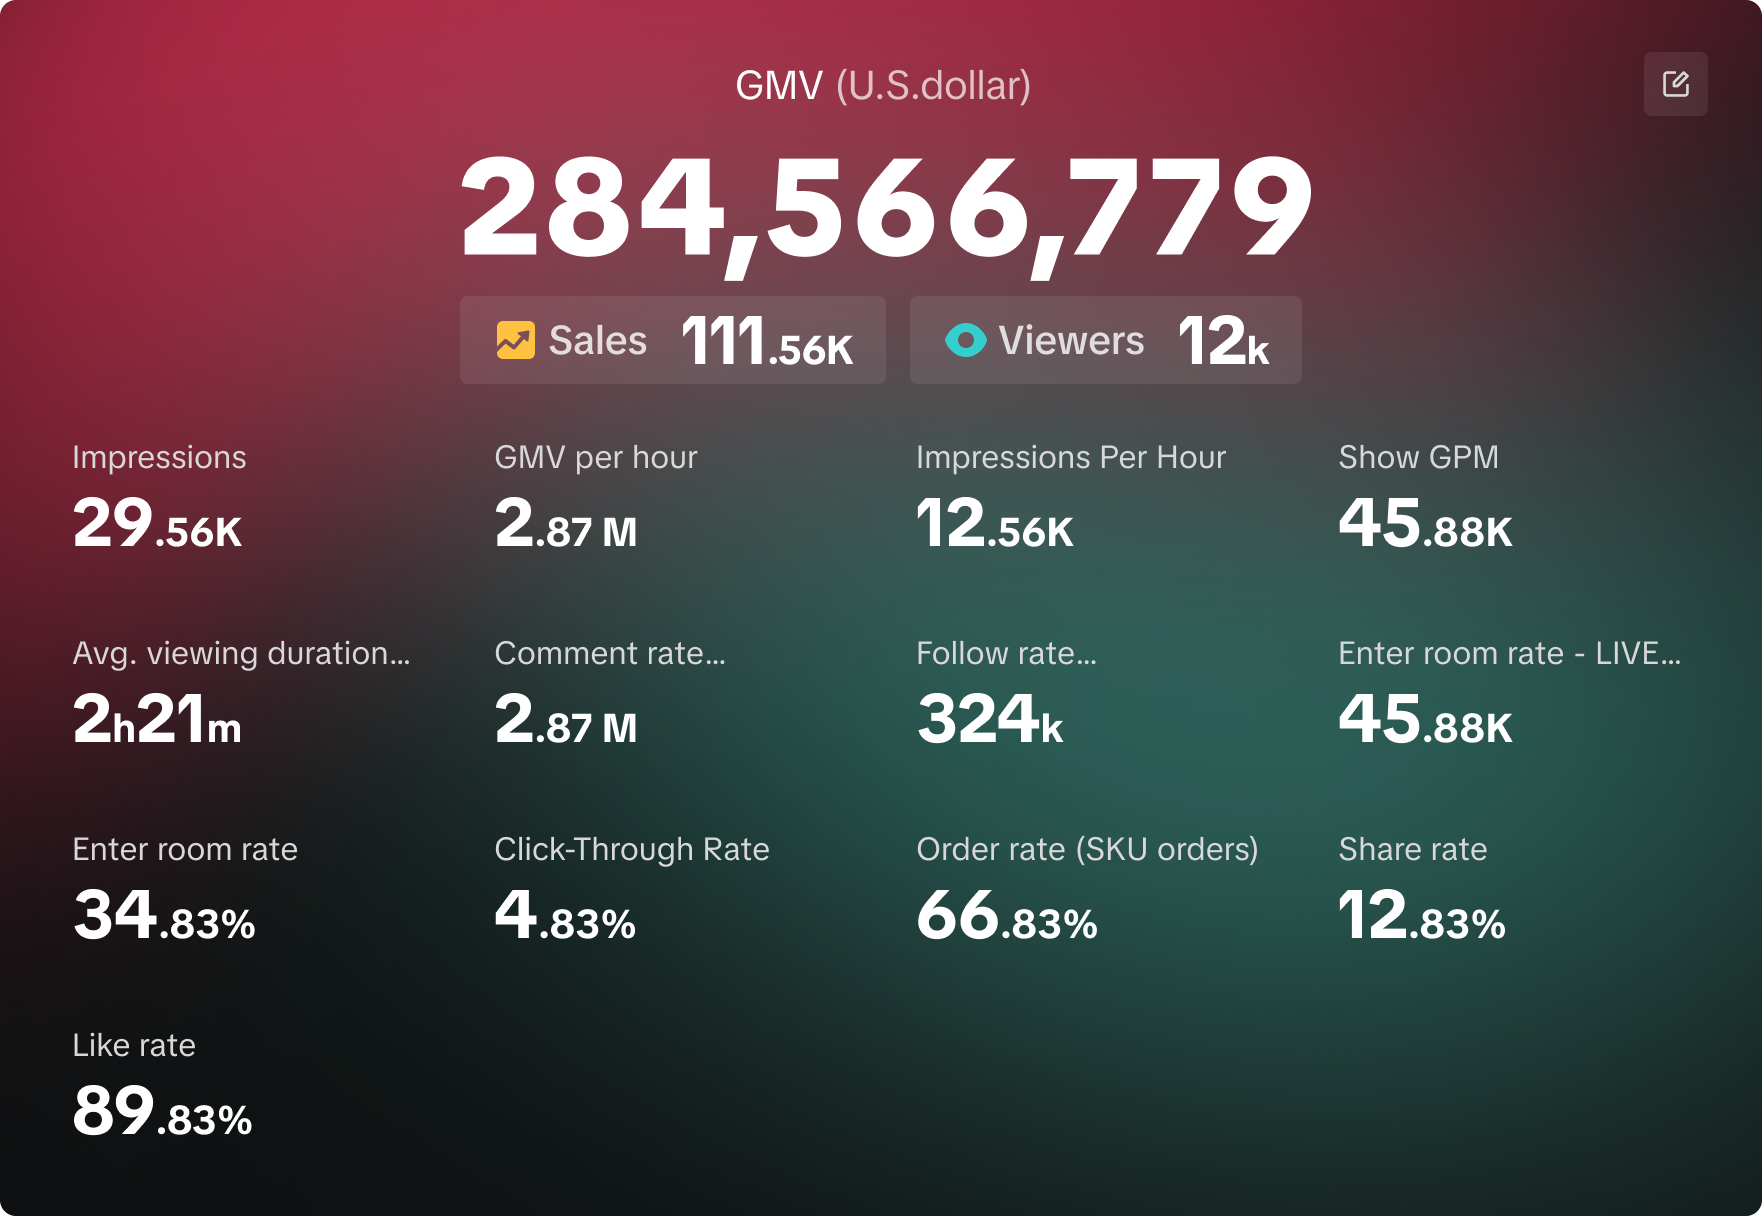 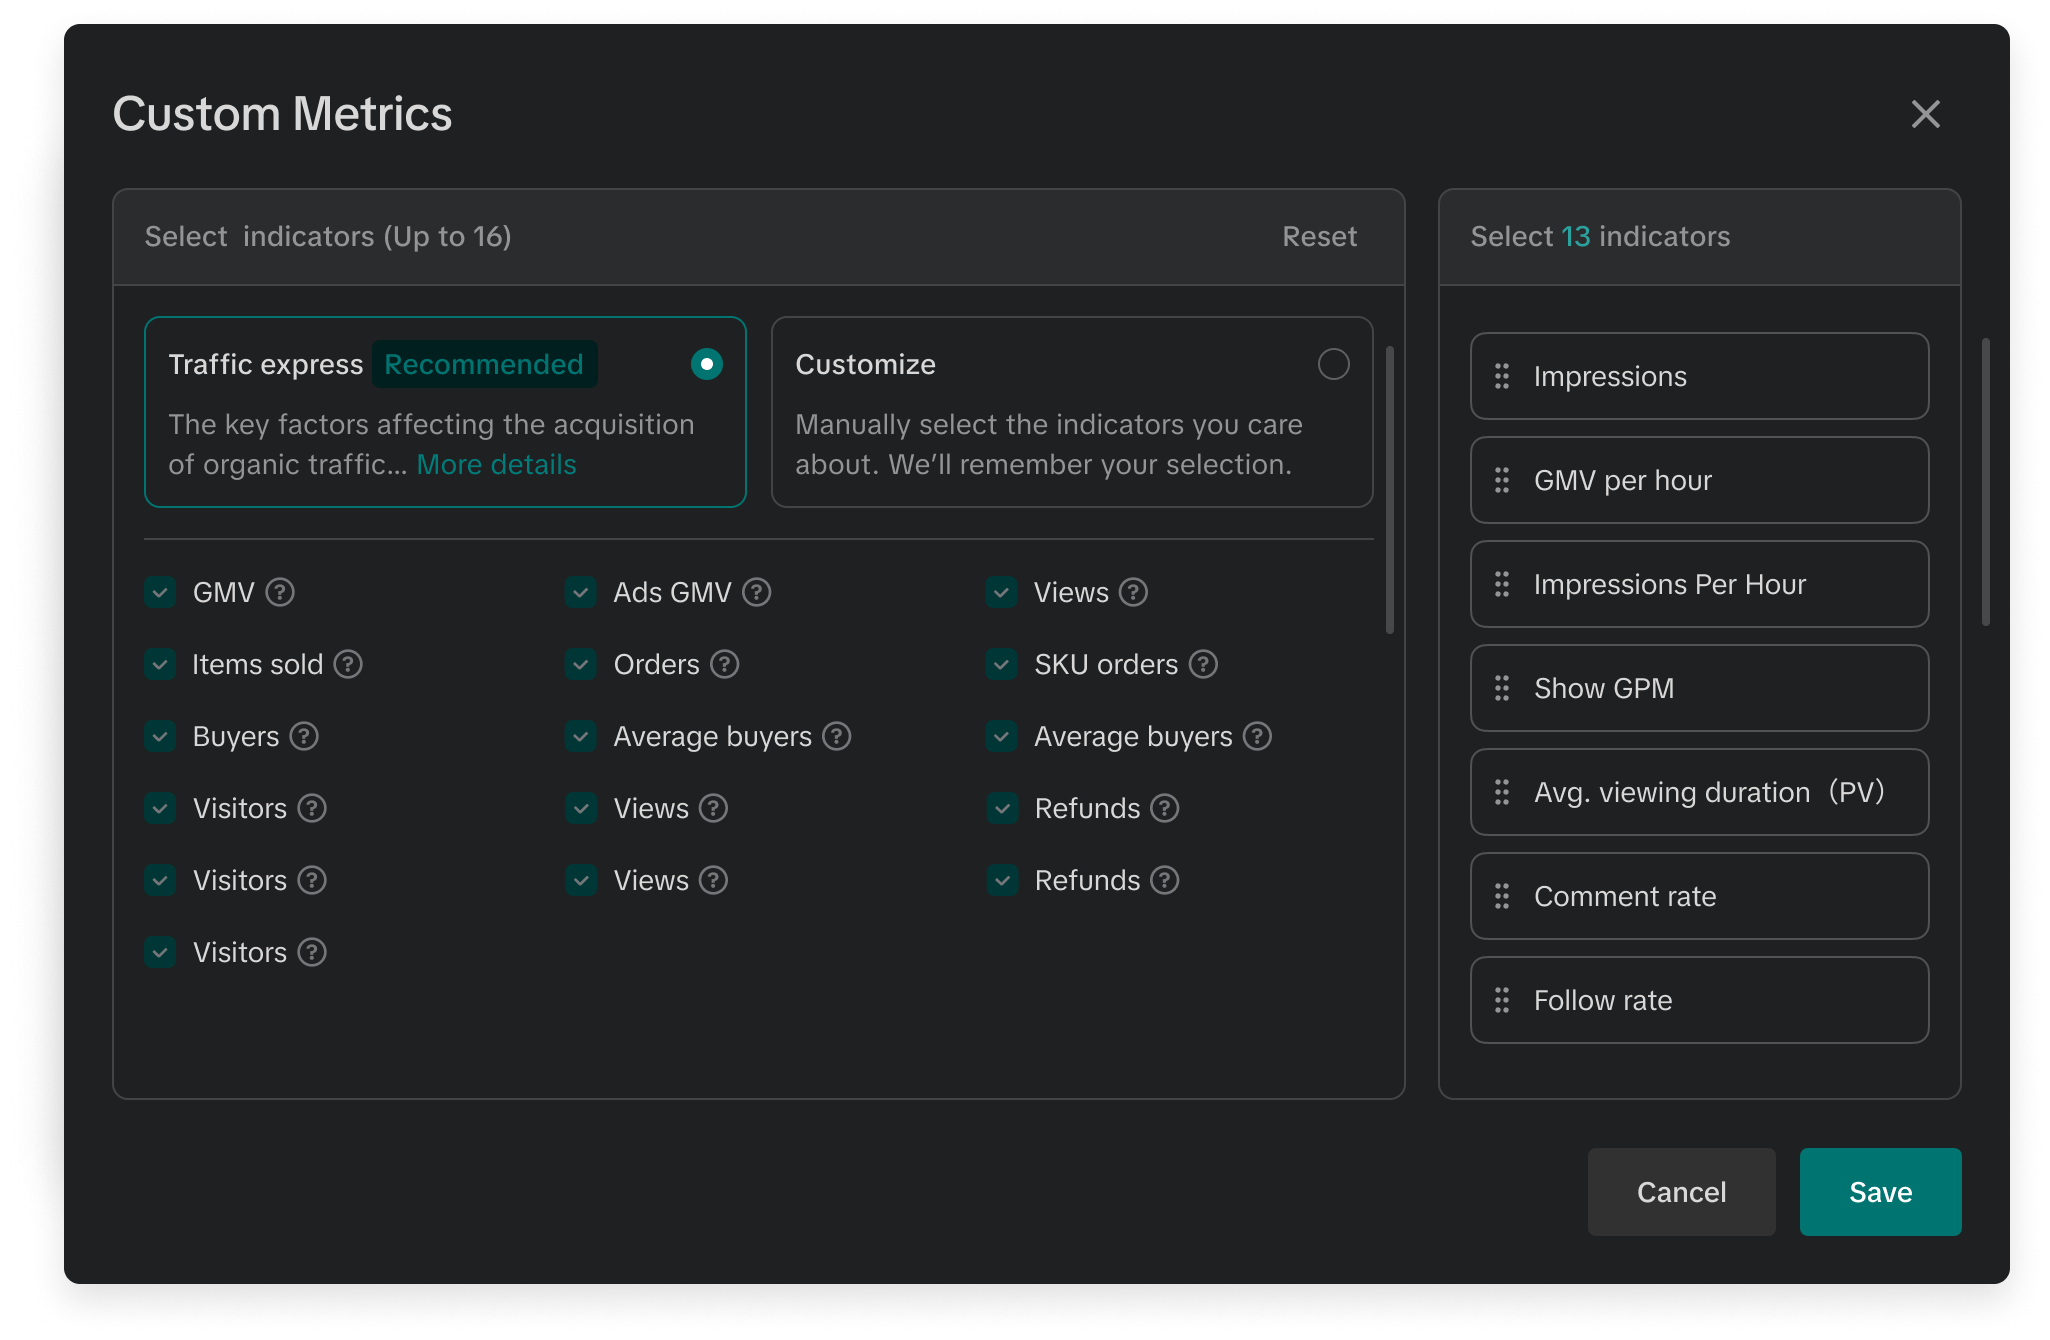 | For all Creators and Sellers - During and after the LIVE | [PC] LIVE Dashboard -> Overview -> Core data[APP] Shopping Bag Analytics |
|
During LIVE: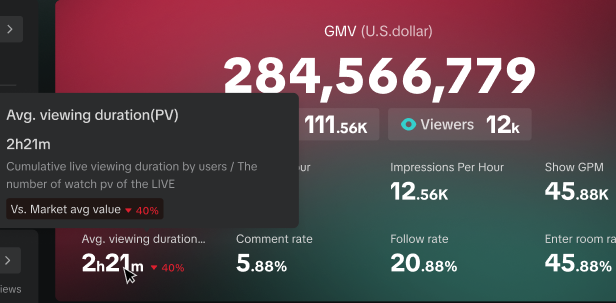 |
| ||
After LIVE: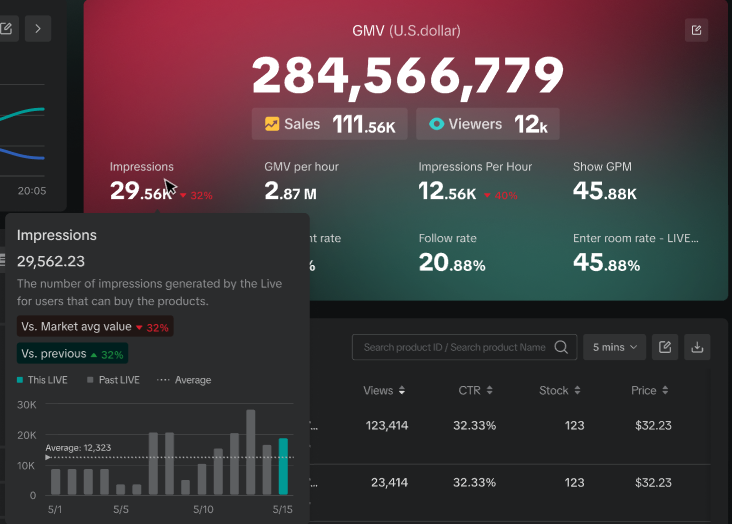 |
|
4.2 Strategies to optimize traffic across channels
Knowing deviations across various key LIVE metrics is only half of the story in optimizing overall LIVE traffic. Understanding these deviations and the fluctuations that are driven across different traffic sources, along with measures/strategies to improve traffic across channels, is quite critical to long-term traffic optimization for LIVEs.Before we look into deep dive guidelines and strategies, you can refer to the section below.
| Optimization scenario | Interface | Where and what to look for | Recommended Analysis Guidelines | Strategies |
| Assess traffic impact through violations | 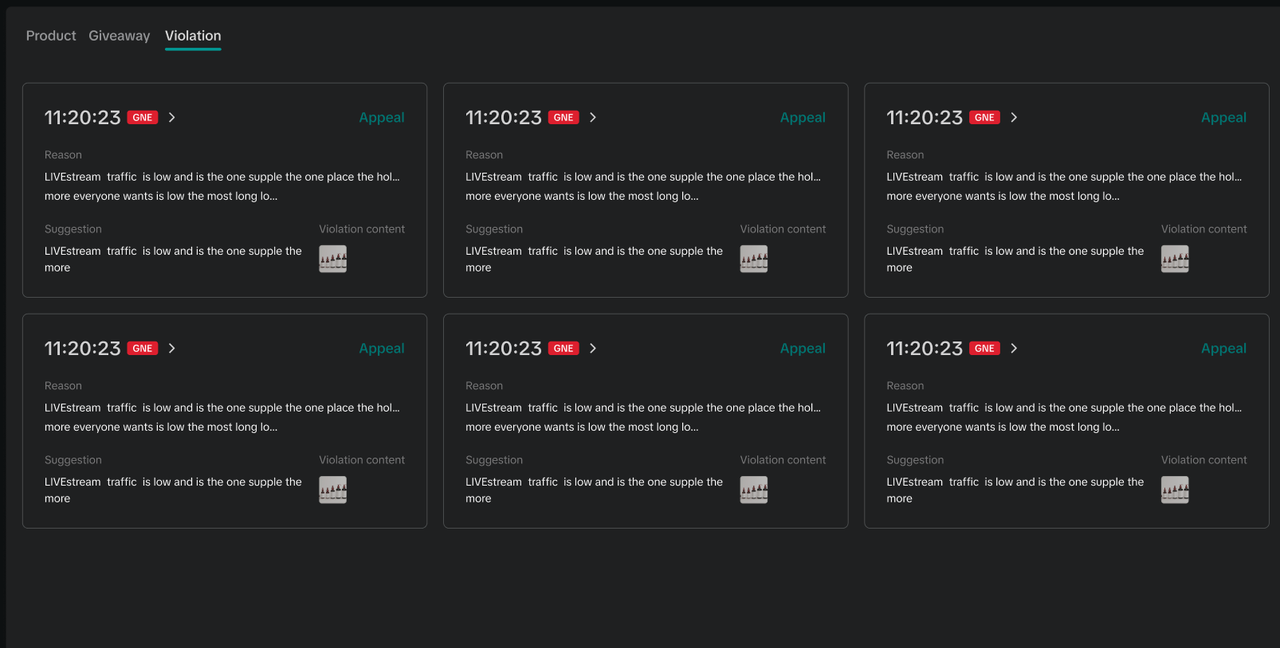 | [PC] LIVE Dashboard -> Performance Trends -> Content Quality |
|
|
| Optimize trends for key traffic metrics | 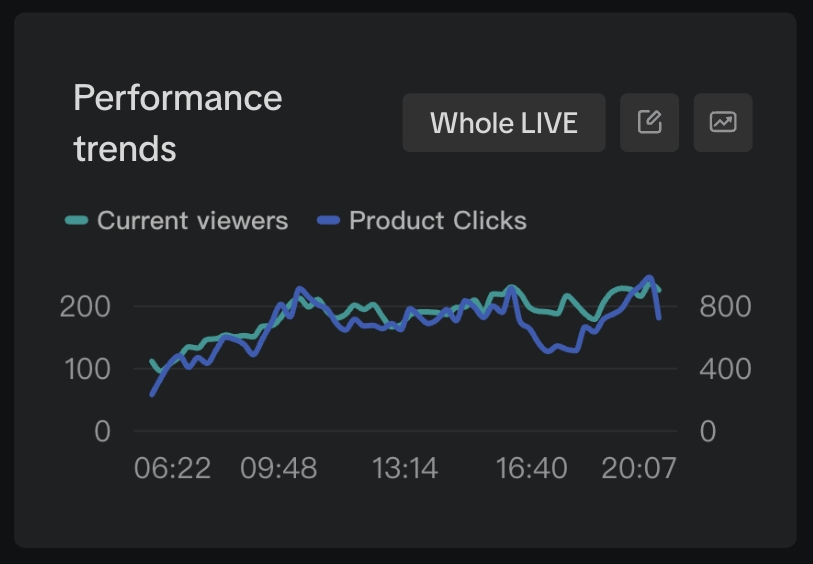 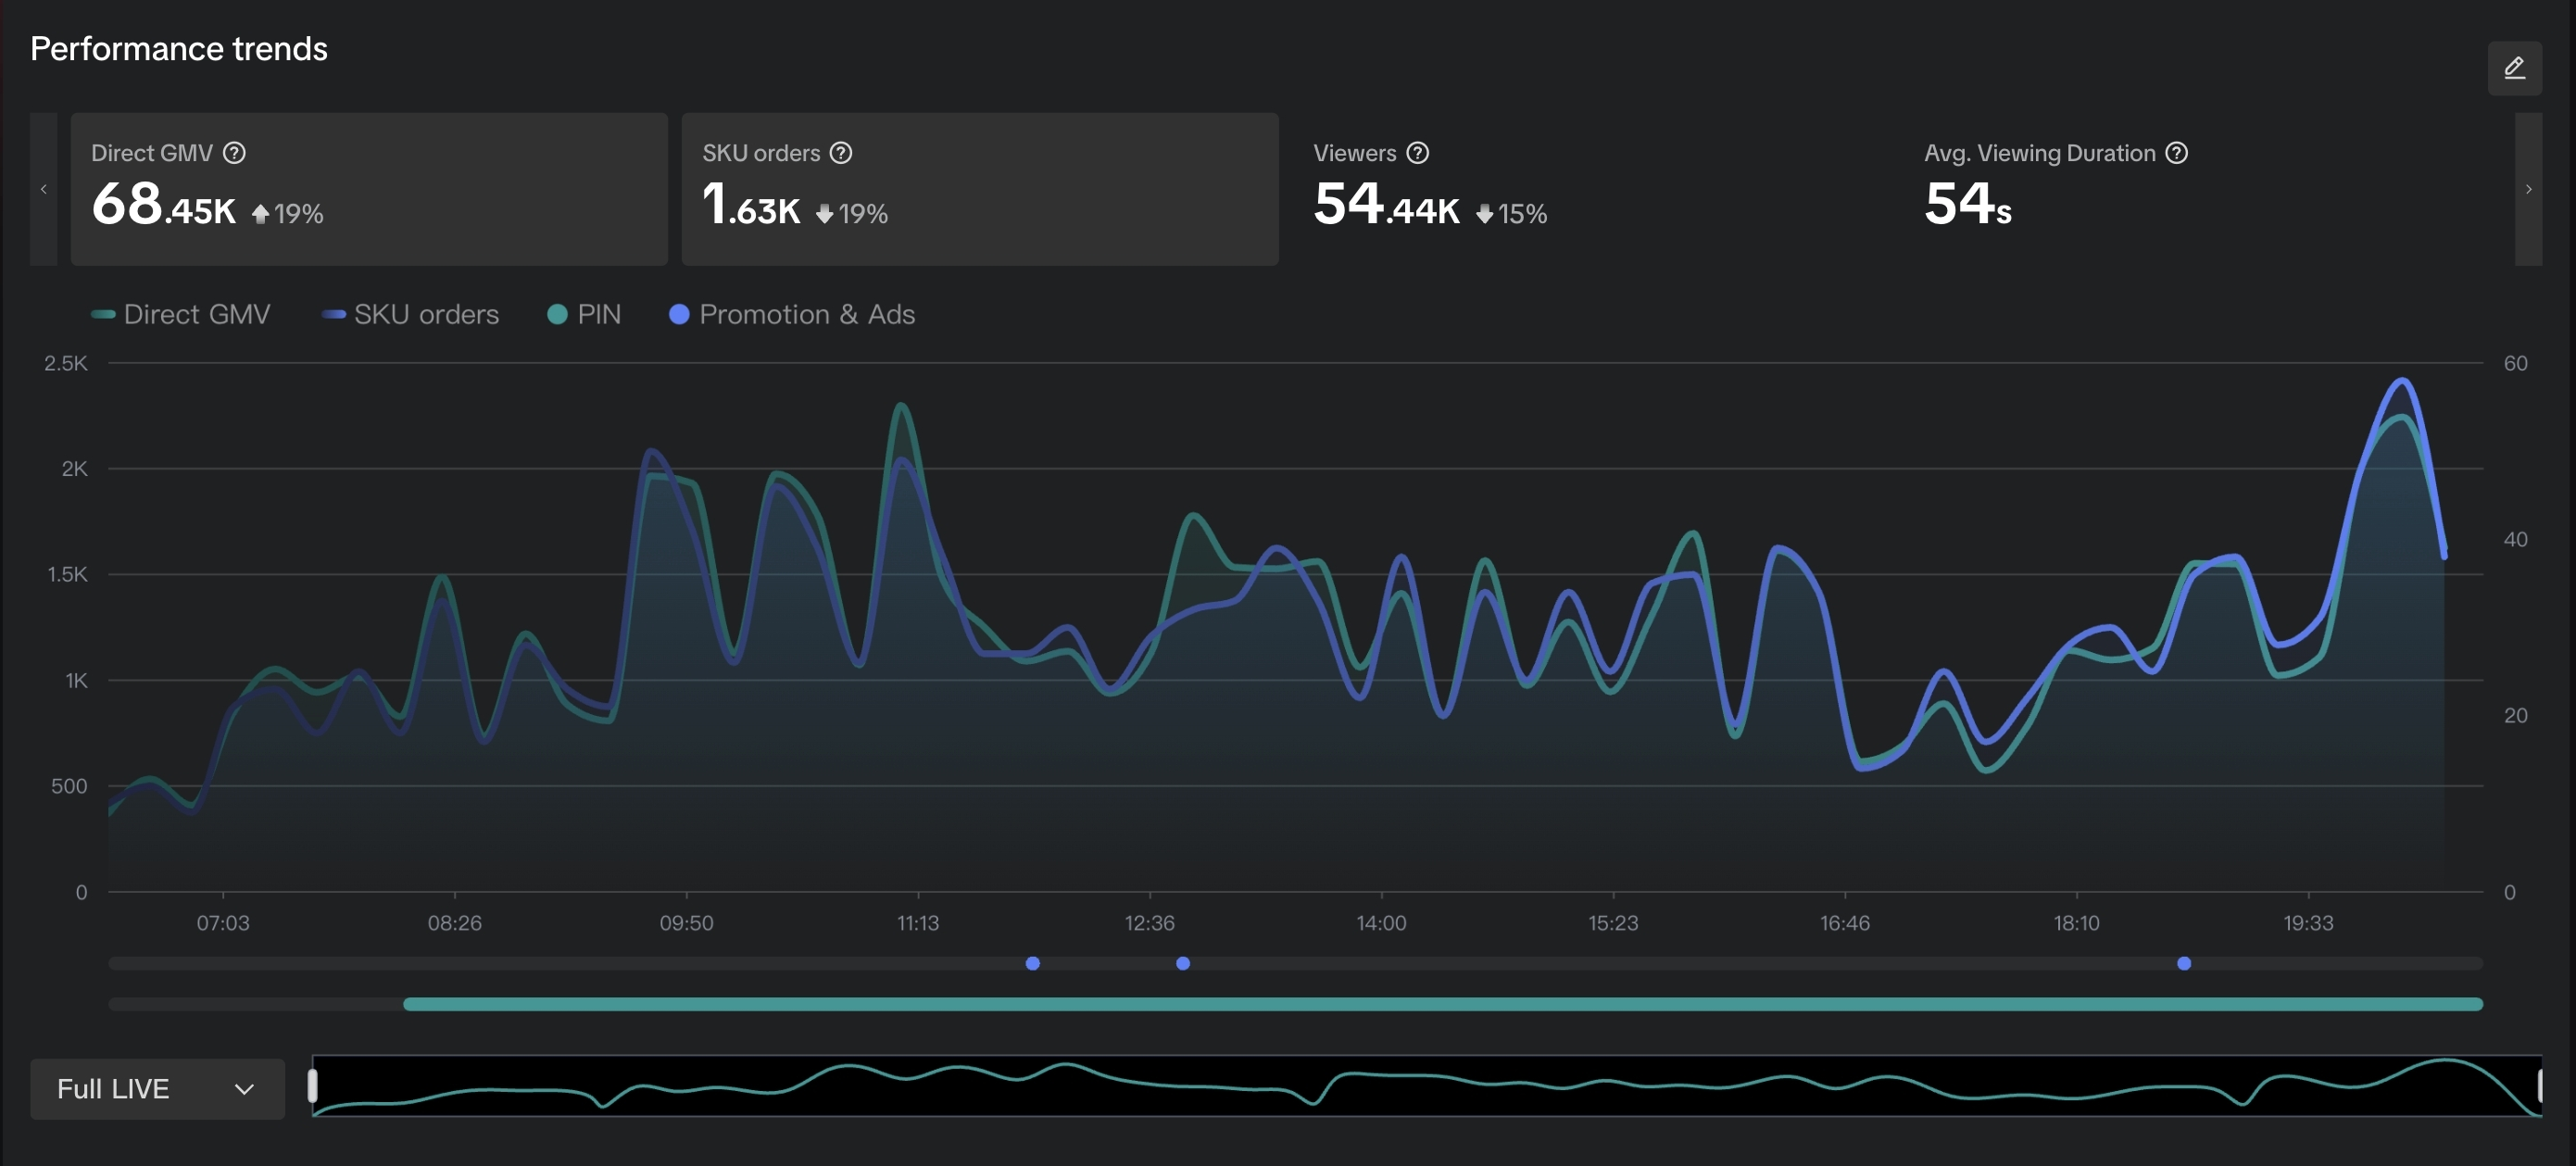 | [PC] LIVE Dashboard -> Overview Tab -> Performance trends[PC] LIVE Dashboard -> Performance trends Tab |
|
|
| Optimize For you Page traffic | 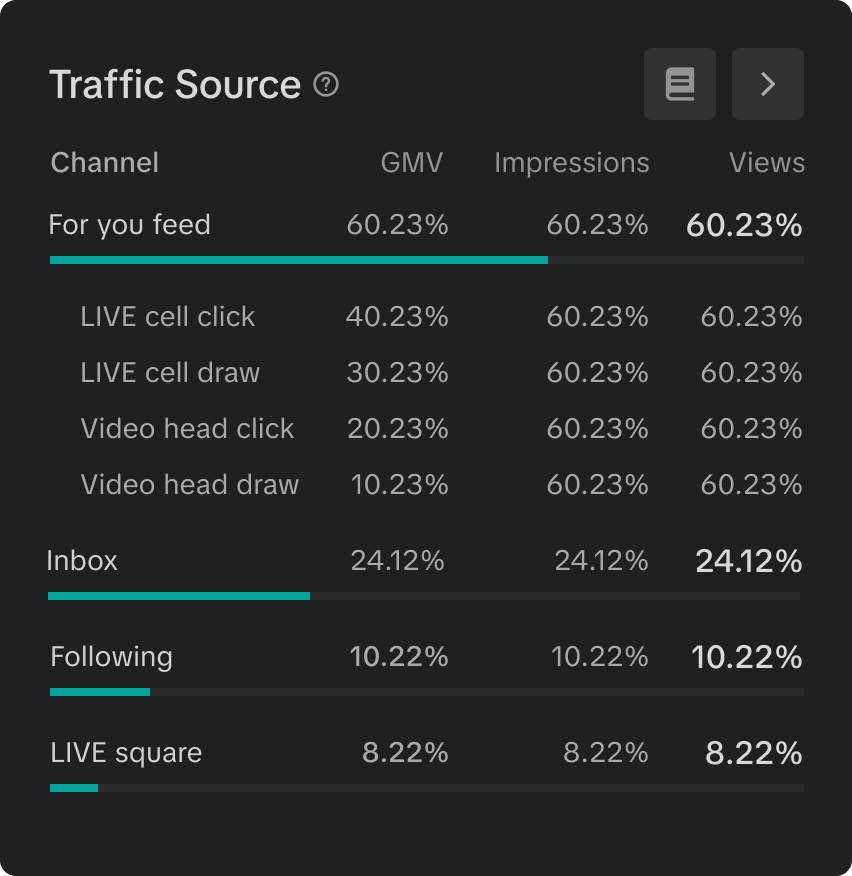 | [PC] LIVE Dashboard |
| |
| Optimize Follower and Inbox traffic | 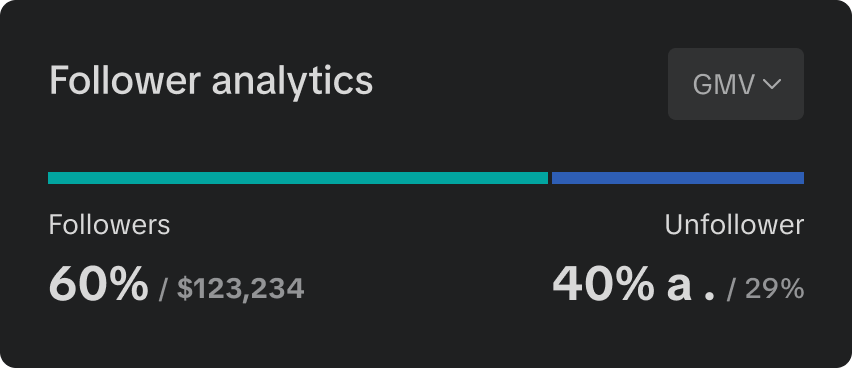 | [PC] LIVE Dashboard |
|
|

Conclusion and next steps
Analyzing and optimizing your LIVE traffic can be daunting and usually requires some practice and a formal routine to develop and fine-tune. A few closing thoughts on how to best develop this routine effectively:- During your LIVE: Look at the essential aspects of your LIVE traffic performance, including the below aspects to understand salient traffic patterns and react to the same, in real-time.
- Core traffic driving metrics
- Impressions and ERR trends for your LIVE
- Distribution of traffic inflow into your LIVE across multiple traffic sources
- Product specific traffic and conversion data
- After your LIVE: Look at your overall account level data and perform a more thorough deep-dive into traffic patterns and drivers. This includes a deeper dive into:
- How your account level performance was affected after the conclusion of the latest LIVE session
- Deeper dive into more metric insights for the particular LIVE session, including looking at metric benchmarks and variations from historical performance from the worst performing metrics
- Make it a point to review your account level data at least, once every 7 days, so that you're broadly aware of the metric dips and deviations and look to analyze any LIVE session over 1-2 hrs to understand overall traffic fluctuations and seek opportunities for improvement.
And as always, enjoy your LIVE sessions!
Anda mungkin juga tertarik
- 1 lesson
Success Strategies of SARAN, A Thai Jeans Brand on TikTok Sh…
SARAN, A Thai-owned shop, stands out with its dedication to quality products and unique live selling…
- 1 lesson
Seller success story - iPIM Shop
iPim Shop opened in June 2023, when TikTok Shop set a challenge for sellers to stream for seventy ho…
- 1 lesson
Tinybity’s Stellar Journey in Live Selling on TikTok Shop
New explained to the team that although many stores sold similar products, few took live selling ser…
- 1 lesson
Key Steps for Starting a Livestream
Sellers will learn the basics of starting a live selling session on TikTok, tailored specifically fo…
- 1 lesson
Kruwhan English: Strategies for Capturing Customer Hearts an…
Kruwhan English, a brand that has achieved significant success on TikTok Shop, has proven that combi…
- 1 lesson
Chubby Brand: The Journey to Become a Popular Teen Favorite…
Beat started selling products since he was young because he wanted to earn income while studying. In…
LIVE Quick Product Post
In this article, we will teach you how the LIVE Quick Product Post feature works and how it can bene…
LIVE Highlights Replay on PDP
LIVE Highlights is a tool designed to provide you with the best-performing segments of your livestre…

Auto-Posting Teaser
This article gives you a brief overview of what an Auto-Post Teaser feature is and how it can benefi…